Analysing wealth in Spain: 20 years of the Spanish Survey of Household Finances
How is wealth or home ownership distributed among Spanish households? For the last 20 years the Banco de España’s Spanish Survey of Household Finances has provided rich information on Spanish households’ finances and enabled the analysis of these and many other related questions.
It’s often said that economists focus more on macro aggregates, such as GDP or inflation, than on other matters that directly affect the public like: How are the fruits of growth shared among households? What do they invest their savings in? How has the concentration of wealth and home ownership changed? What type and how much debt do households have? Does it depend on our income level? Until relatively recently these types of questions went unanswered for Spain because there were no data to perform a thorough analysis. That’s why in 2002 the Banco de España launched the Spanish Survey of Household Finances![]() (EFF by its Spanish initials), a pioneering survey in the euro area that has made a key contribution to understanding Spanish household finances and the Spanish economy.
(EFF by its Spanish initials), a pioneering survey in the euro area that has made a key contribution to understanding Spanish household finances and the Spanish economy.
What data does the EFF include and why is it so useful?
Three features of the EFF stand out:
- It is the only source that provides detailed and extensive information on household finances. A single database spanning back to the early 21st century that contains data on not only household wealth (their assets, goods and properties), but also on the different sources of income, employment status, debts and expenses.
- The survey is representative of household total wealth. The EFF makes a special effort to compile information on the richest households, who hold a large share of Spain’s wealth but are underrepresented in other surveys because there aren’t many of them.
- It depicts changes in household income and wealth over households’ lifetimes. It is able to do this because the EFF follows the same households over several years, interviewing them in successive rounds of the survey.
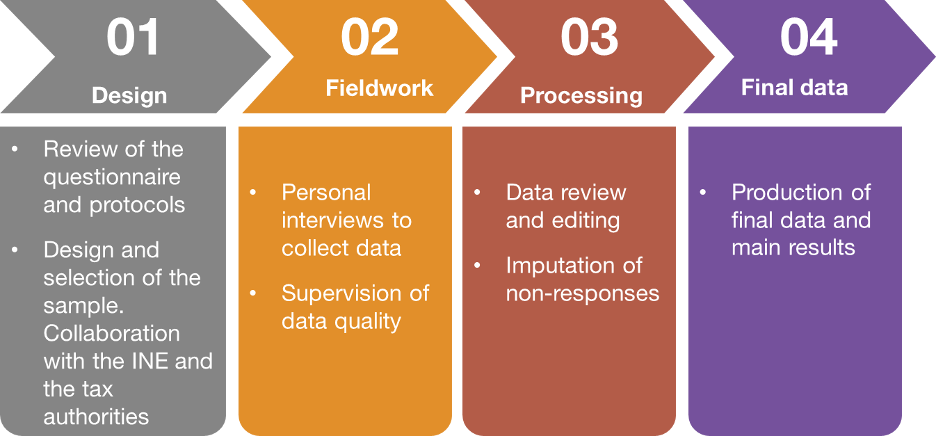
Preparation of the EFF, which is summarised in Figure 1, is a cumbersome process. The aim is to ensure both data quality and the respondents’ anonymity. For each edition of the survey around 6,300 Spanish households are interviewed in person. We use the most advanced statistical, artificial intelligence and data science methods to help with data collection and make the process more efficient by facilitating the monitoring of the fieldwork, the detection of inconsistencies and even the transcription of recorded interviews.
Figure 1
HOW IS THE SPANISH SURVEY OF HOUSEHOLD FINANCES (EFF) PREPARED?
SOURCE: Banco de España
After the recent publication of its latest edition, with data for 2022, there are now eight editions of the EFF. The survey, which was held every three years from 2002 to 2020, has been conducted biennially since then, marking a unique approach within the Eurosystem. The reason for this higher frequency is that the information the EFF provides has become crucial to understanding and analysing households’ economic behaviour and economic developments in Spain.
Until 2002 there weren’t enough data for in-depth analysis of household finances and wealth distribution in Spain. The EFF, a trailblazing survey in Europe, filled that gap
Two examples: housing and the generational distribution of wealth
The EFF allows for in-depth analysis of major issues. For instance, it provides a snapshot of the accumulation of wealth by different generations of Spaniards over their lifetime.
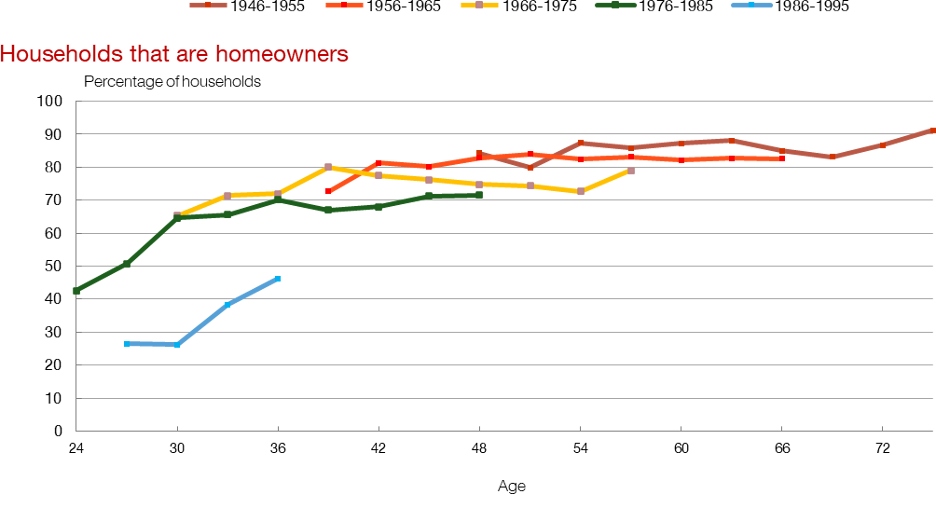
Chart 1 shows the home ownership rate across five generations, according to their age. The change in home ownership in Spain is striking. In 2022 the generation born between 1945 and 1965 had home ownership rates at age 42 above 81%, whereas for those born between 1975 and 1985 this percentage was 67%, 14 percentage points lower. This reduction in home ownership appears to be accelerating for those born after 1985, who are currently under 40.
The EFF shows that home ownership and net wealth have decreased among younger generations
Chart 1
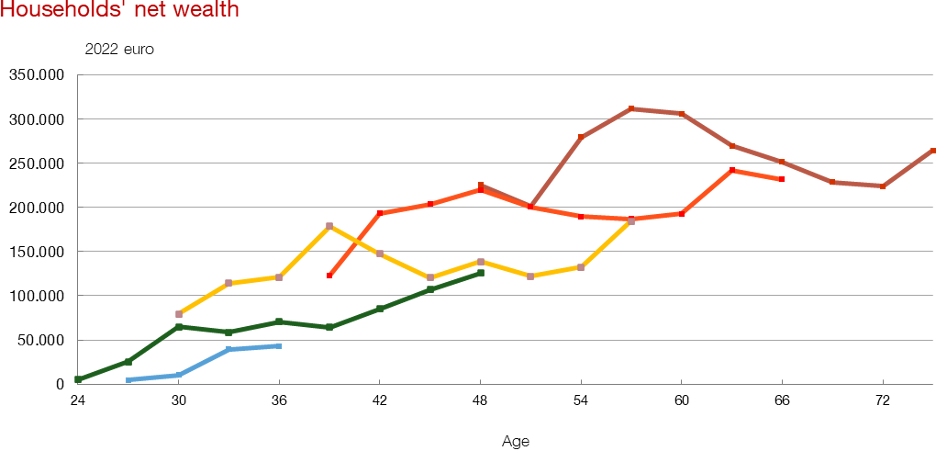
HOME OWNERSHIP AND NET WEALTH. DIFFERENCES BETWEEN GENERATIONS
SOURCE: Spanish Survey of Household finances (EFF![]() ), 2002-2022 editions.
), 2002-2022 editions.
NOTE: The charts show on the vertical axis the percentage of households that are homeowners (top panel) and households' net wealth - assets minus debts - (bottom panel) and on the horizontal axis the age of the household head. Each line shows the data for one cohort, defined by the birth years indicated in the legend, and represents how each variable changes as the generation gets older.
The second panel of the chart tells a similar story regarding households’ median net wealth (assets minus debts) in 2022 euro. It shows that younger generations are accumulating less wealth than their predecessors. For example, the 1956-1965 generation had a median net wealth of just over €200,000 by age 45, almost twice as much as the 1976-1985 generation at the same age (€107,031).
The EFF has also made it possible to address other interesting questions, such as:
- how wealth inequality has changed over time in Spain (for example, here
 , here and here)
 - how household wealth responds to the risk of job loss,
- how couples manage their wealth (here and here), and
- how the differences in household structure between Spain and the United States partly explain the differences in wealth inequality.
Moreover, the EFF’s microdata are readily available to analysts at no cost through a dedicated, user-friendly website![]() , thereby amplifying their research potential.
, thereby amplifying their research potential.
How does Spain compare to other countries?
The EFF has blazed a trail in the euro area, inspiring other countries to develop similar surveys. It is part of the Household Finance and Consumption Survey (HFCS)![]() , coordinated by the European Central Bank, which has been providing comparable data for various euro area countries every three years since 2011. The latest HFCS edition refers to 2021.
, coordinated by the European Central Bank, which has been providing comparable data for various euro area countries every three years since 2011. The latest HFCS edition refers to 2021.
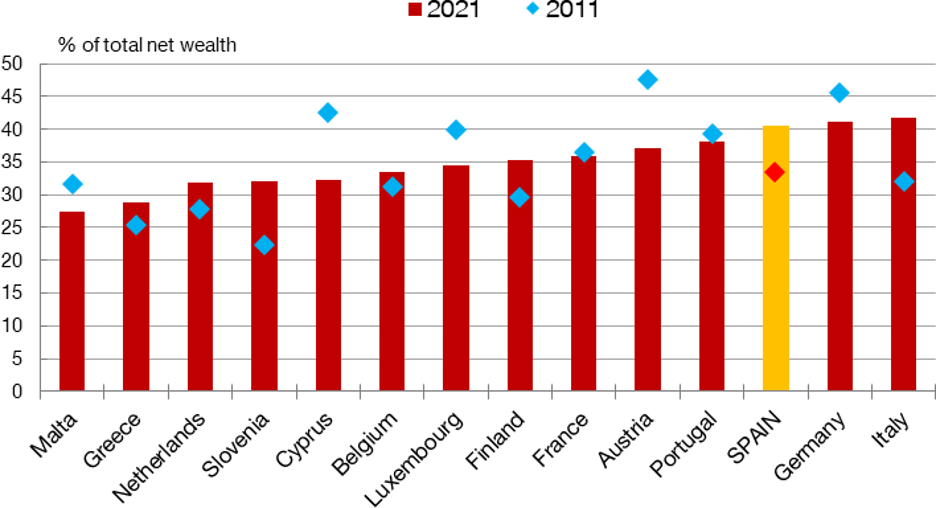
By way of example, Chart 2 shows how the concentration of net wealth has changed over time in various euro area countries. Between 2011 and 2021 the percentage of net wealth held by the richest 5% of households increased by almost 7.3 percentage points in Spain, somewhat less than in Italy. By contrast, this percentage decreased in Germany, France and Portugal.
Chart 2
PERCENTAGE OF NET WEALTH CONCENTRATED IN THE RICHEST 5% OF HOUSEHOLDS
SOURCE: ECB's Household Finance and Consumption Survey![]() ,
,
Looking ahead: surveys in a data-driven world
The availability and richness of microdata![]() has grown exponentially in recent times. Looking ahead, the main challenge for the EFF is finding synergies with other statistical sources to continue improving how we measure and analyse household finances. One way would be to incorporate comparable administrative data, a task to which the Banco de España is strongly committed
has grown exponentially in recent times. Looking ahead, the main challenge for the EFF is finding synergies with other statistical sources to continue improving how we measure and analyse household finances. One way would be to incorporate comparable administrative data, a task to which the Banco de España is strongly committed![]() . It is also essential to broaden the information gathered about household expectations, their subjective degree of satisfaction and the reasons for their decisions, among other relevant aspects. All of these are areas for improvement on which we are already working.
. It is also essential to broaden the information gathered about household expectations, their subjective degree of satisfaction and the reasons for their decisions, among other relevant aspects. All of these are areas for improvement on which we are already working.


DISCLAIMER: The views expressed in this blog post are those of the author(s) and do not necessarily coincide with those of the Banco de España or the Eurosystem.
