The Banco de España can also establish a sectoral component of the countercyclical capital buffer and limits on sectoral concentration. The rationale behind these sectoral tools is that in prior crises most of the systemic risks were concentrated in specific sectors. In these cases, aggregate macroprudential tools are expected to be less effective.
Sectoral component of the countercyclical capital buffer
Incorporating a sectoral component into the countercyclical capital buffer is a technical improvement that enables its application both to exposures taken as a whole and to specific sectors, and even to both at the same time. Its activation for specific sectors shall be determined on the basis of a broad range of early warning indicators on sectoral imbalances in Spain.
Some examples of charts monitoring imbalances to inform decisions on the sectoral components of the countercyclical capital buffer
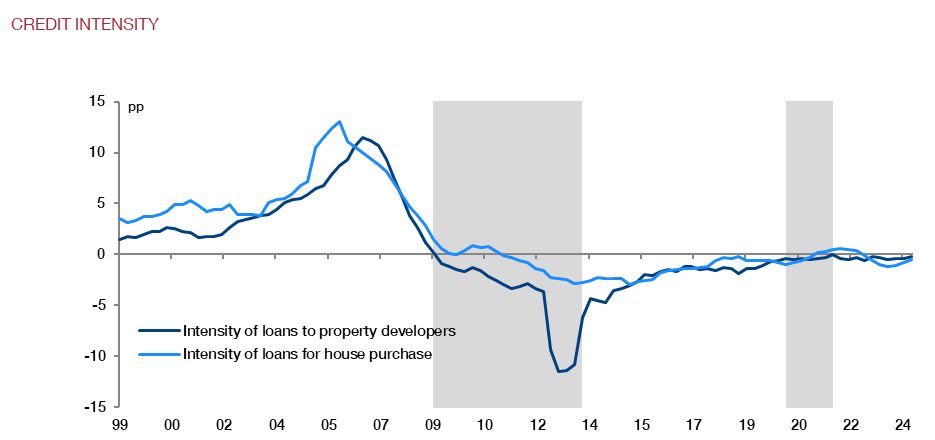
Sectoral credit intensity
The chart depicts the intensity of lending to real estate developers and to households for house purchase. Their pattern is very similar: after falling during the sovereign debt crisis, they performed in parallel up to the onset of the crisis induced by the COVID-19 pandemic. Both indicators suggest a lack of systemic vulnerabilities at present.

SOURCES: INE, Banco de España and own calculations.
Note: The credit intensity indicator is calculated as the annual change in the sector's aggregate credit (numerator) divided by cumulative GDP over the same period (denominator). The grey shaded areas show two financial crisis periods identified in Spain since 2009, namely the systemic banking crisis (2009 Q1 to 2013 Q4) and the systemic crisis triggered by COVID-19 (2020 Q1 to 2021 Q4).
Concentration limits
Limits on sectoral concentration complement the sectoral component of the countercyclical capital buffer. Activating the limits curbs growth of sectoral concentration more directly than the countercyclical capital buffer, as they limit the volume of credit exposures to a specific sector, established in terms of the ratio of sectoral exposure to the CET1 of banks.
Some examples of charts monitoring decisions on limits on sectoral concentration
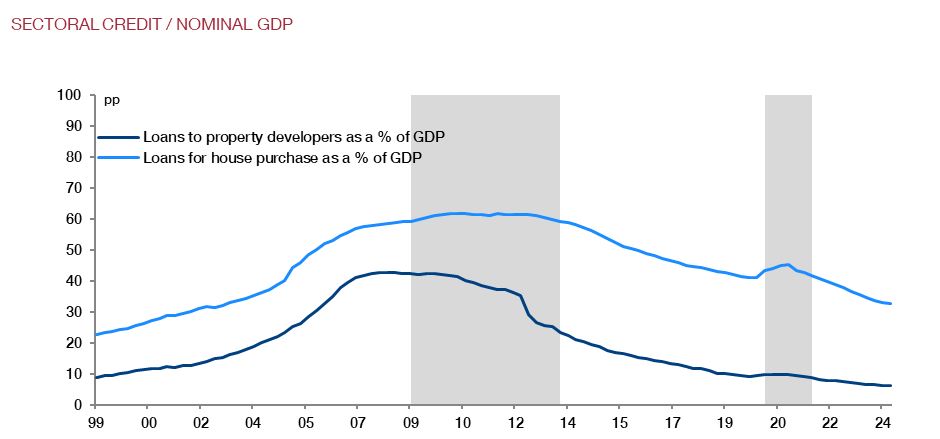
Sectoral lending / Nominal GDP
The chart depicts lending to real estate developers and to households for house purchase as a percentage of nominal GDP. Both variables have stabilised after falling in the wake of the financial crisis. There has been a trend shift in lending to households for house purchase as a percentage of GDP since the onset of the pandemic due to the sharp drop in GDP.

SOURCES: INE, Banco de España and own calculations.
Note: The grey shaded areas show two financial crisis periods identified in Spain since 2009, namely the systemic banking crisis (2009 Q1 to 2013 Q4) and the systemic crisis triggered by COVID-19 (2020 Q1 to 2021 Q4).

