Is reducing carbon emissions compatible with economic growth?
Squaring lower carbon emissions with growth requires energy efficiency to be improved and energy to be “decarbonised”. Headway on these fronts since the early 21st century has helped reduce emissions in Spain and Europe, but we must go much further if we are to achieve our climate targets.
Climate summits, such as the recent COP28![]() , remind us of the urgent need to lower greenhouse gas emissions. Achieving this goal is one of the main challenges of the fight against climate change. Doing so while hurting economic growth as little as possible is another major challenge. This is because, in principle, as economic activity increases, more energy is consumed and more carbon dioxide (CO2) is emitted. However, severing this link and continuing to grow while lowering carbon emissions is possible. This post explains how.
, remind us of the urgent need to lower greenhouse gas emissions. Achieving this goal is one of the main challenges of the fight against climate change. Doing so while hurting economic growth as little as possible is another major challenge. This is because, in principle, as economic activity increases, more energy is consumed and more carbon dioxide (CO2) is emitted. However, severing this link and continuing to grow while lowering carbon emissions is possible. This post explains how.
What determines carbon emissions?
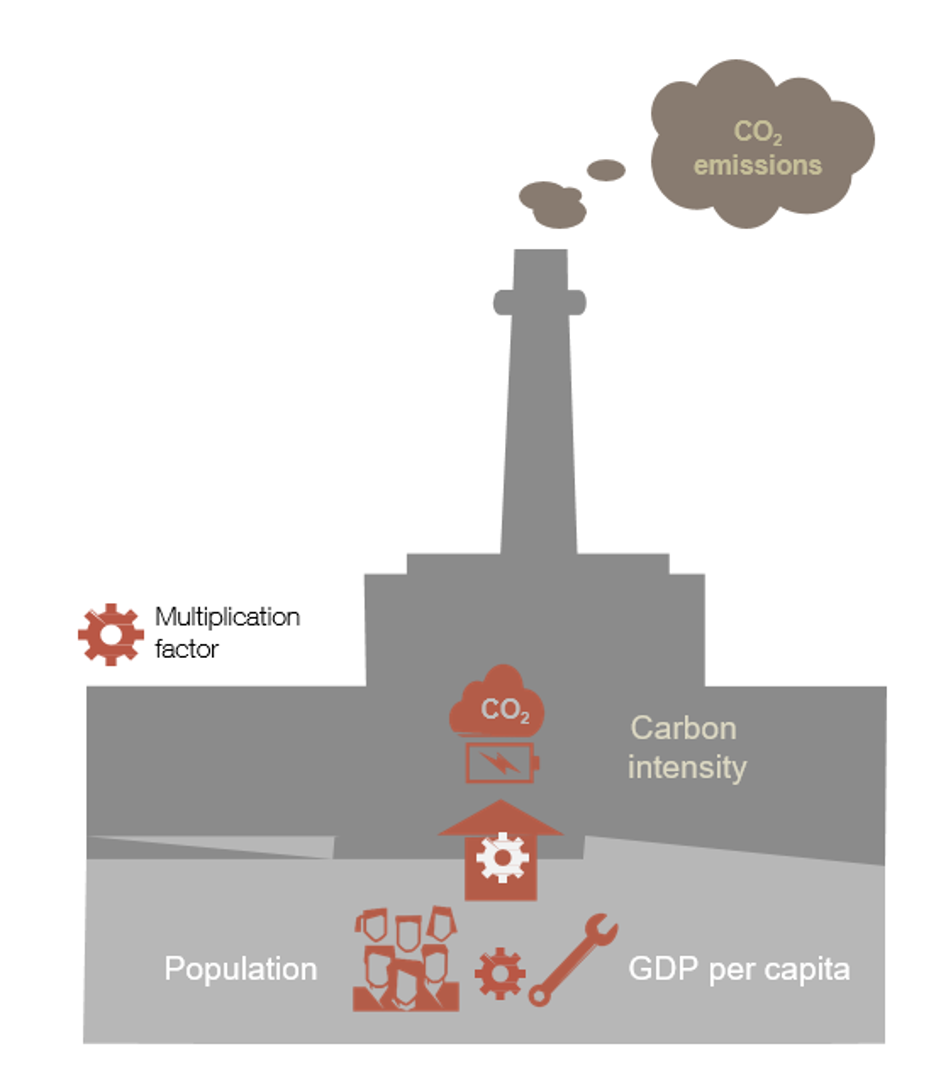
The Kaya identity shows the relationship between total carbon emissions and their main drivers (see Figure 1). According to this identity, as global output rises, whether because the world population grows or GDP per capita increases, so too should emissions. Yet, and this is key, carbon emissions are also driven by carbon intensity.
Figure 1
DETERMINANTS OF CARBON (CO2) EMISSIONS
SOURCE: Banco de España.
NOTE: The figure depicts the Kaya identity, where emissions are the product of their determinants. Specifically:
Volume of CO2 emissions = population x GDP per capita x carbon intensity
Carbon intensity is the amount of CO2 emitted by an economy per unit of gross domestic product (GDP).
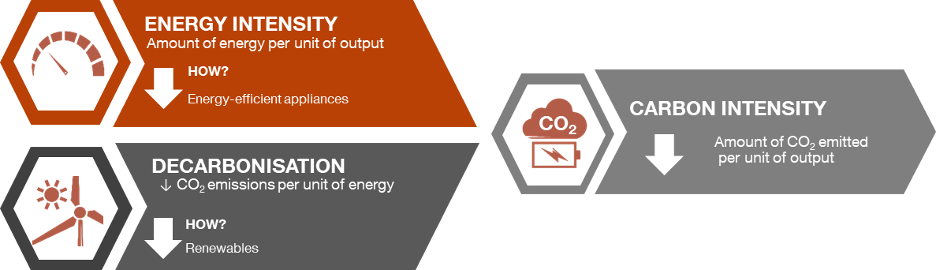
Carbon intensity is defined as the amount of CO2 emitted per unit of output – i.e. for each unit of goods and services produced in the economy – and is broken down into two factors:
- Energy intensity, in other words, the amount of energy the economy consumes to produce a unit of output.
- CO2 emissions per unit of energy produced or consumed.
As summarised in Figure 2, this breakdown helps explain how emissions can be reduced without hurting growth.
Figure 2
HOW TO REDUCE CARBON INTENSITY AND EMISSIONS
SOURCE: Banco de España.
NOTE: Carbon intensity is the result of multiplying energy intensity by CO2 emissions per unit of energy generated.
There are two ways to reduce carbon intensity. What’s more, these strategies can be deployed simultaneously:
- By improving energy efficiency, which reduces energy intensity. For instance, when new appliances or machines emerge that perform the same task as the old ones, but use less energy, efficiency increases and emissions fall.
- The decarbonisation of energy generation processes, i.e. by reducing CO2 emissions per unit of energy generated. For example, renewables, such as solar and wind power, produce far fewer emissions than energy generated by burning fossil fuels.
What lies behind the drop in emissions?
Emissions have started to level off thanks to the reduction in carbon intensity
Chart 1 shows how global carbon emissions increased steadily until the mid-2010s, amid a sharp rise in the global population and economic activity.
Since then, emissions have started to level off thanks to the reduction in carbon intensity. This has been driven by the various international climate agreements reached in recent decades, such as the 1997 Kyoto Protocol![]() (the first of its kind) and, more recently, the 2016 Paris Agreement.
(the first of its kind) and, more recently, the 2016 Paris Agreement.![]()
Chart 1
GLOBAL CARBON EMISSIONS HAVE LEVELLED OFF
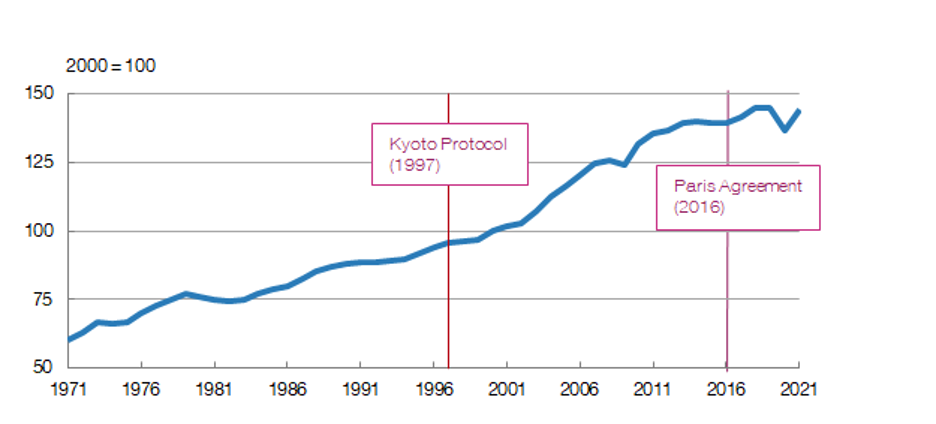
SOURCE: International Energy Agency.
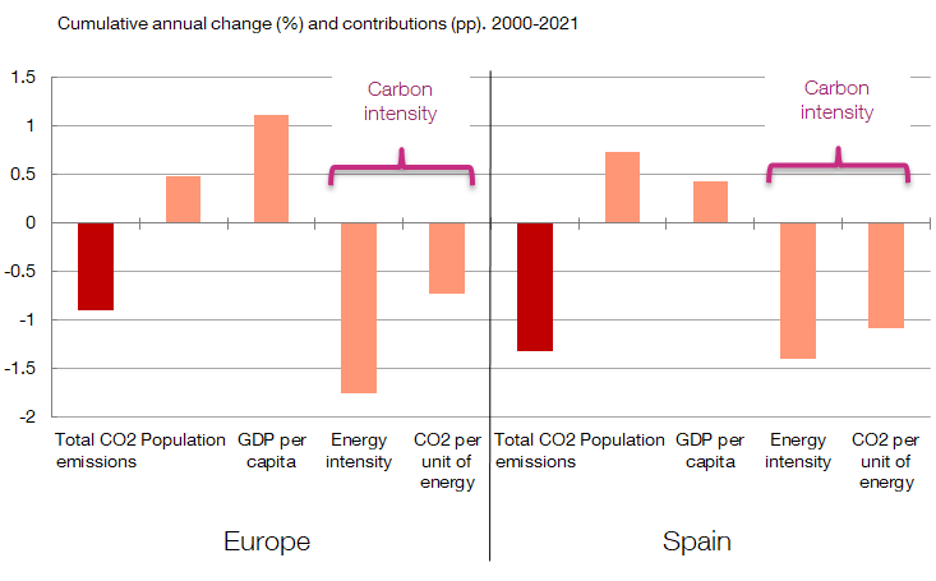
In the developed economies, lower carbon intensity has been key to cutting emissions while activity has continued to grow. For instance, emissions have fallen by 14% in Europe since 2000, while Spain has done better still (24%).
As can be seen in Chart 2, in both cases lower carbon intensity has been driven by its two determinants: lower energy intensity and the decarbonisation of energy generation. In relative terms, the reduction in energy intensity has played a bigger role in Europe as a whole, whereas the two factors have counted for much the same in Spain.
Chart 2
CARBON EMISSIONS ARE FALLING THANKS TO LOWER CARBON INTENSITY
SOURCE: Energy Efficiency Indicators, International Energy Agency.
NOTE. Europe refers to the OECD-member EU countries. The red bars depict the rate of cumulative annual change in total CO2 emissions. The orange bars depict the contributions made by each component, in percentage points (pp). 2023 update.
Carbon intensity has fallen across all economic sectors since the turn of the century, albeit to widely varying degrees. For example, the decline has been greater in sectors (such as services) that rely more on electricity, which can more readily be generated using renewable sources. Conversely, transport remains heavily dependent on fossil fuels for its energy.
Even so, despite this progress, there is no room for complacency: carbon emissions are still very high and there is considerable doubt as to whether, in the coming years, they can be reduced at the rate needed to meet the latest goals![]() .
.
Meeting the emissions reduction targets calls for green electricity generation and electrification
Alongside other ambitious actions, meeting the emissions reduction targets calls for further improvements in energy efficiency and a faster roll-out of renewable energies. Green electricity generation and the electrification of sectors that are still reliant on fossil fuels hold out the promise that our carbon footprint can be reduced without sacrificing growth. There’s no time to lose.

DISCLAIMER: The views expressed in this blog post are those of the author(s) and do not necessarily coincide with those of the Banco de España or the Eurosystem.
