
The Draghi report, two years on: what has been achieved?
Two years after its release, the Draghi Report continues to shape the European Union’s agenda, but its implementation is progressing unevenly. Progress has not always come where reforms are most transformative, most politically feasible or least costly, but where there is a shared sense of urgency.
“The problem is not the lack of ambition among leaders. It is what happens after ambition enters the machinery. Agreements are processed through committees that dilute and delay until the outcome bears little resemblance to what was intended”
Mario Draghi, Speech delivered at the Charlemagne Prize ceremony, May 2026
The Draghi Report, presented in September 2024 and already the subject of a Banco de España blogpost, is shaping the course of European economic policy. The Report set out three broad objectives, or transformations, to halt the European Union’s economic decline and improve its long-term growth potential. The first was to close the innovation gap with the United States and China; the second, to decarbonise the economy; and the third, to strengthen economic security by reducing external dependencies. All this without abandoning the European social model. The Report’s diagnosis and recommendations have since made their way into Brussels’ policymaking, as reflected in the European Commission’s Competitiveness Compass, presented in January 2025. But how much of that ambition has already translated into real change? And which areas have seen the most progress?
To answer these questions, we have analysed the Draghi Report’s reform agenda along three dimensions: the proposals’ transformative impact, their political feasibility and their degree of implementation.
DID YOU KNOW ...?
Our meta-analysis draws on three main sources:
- the Draghi Report itself;
- The Elcano Royal Institute’s assessment and
- implementation data published by the Draghi Observatory of the European Policy Innovation Council (EPIC).
We have grouped the Report’s 176 proposals into nine pillars or areas. These are set out in Figure 1, following the structure and common themes of the Report’s chapters.
We have then assessed each pillar against the three dimensions outlined above:
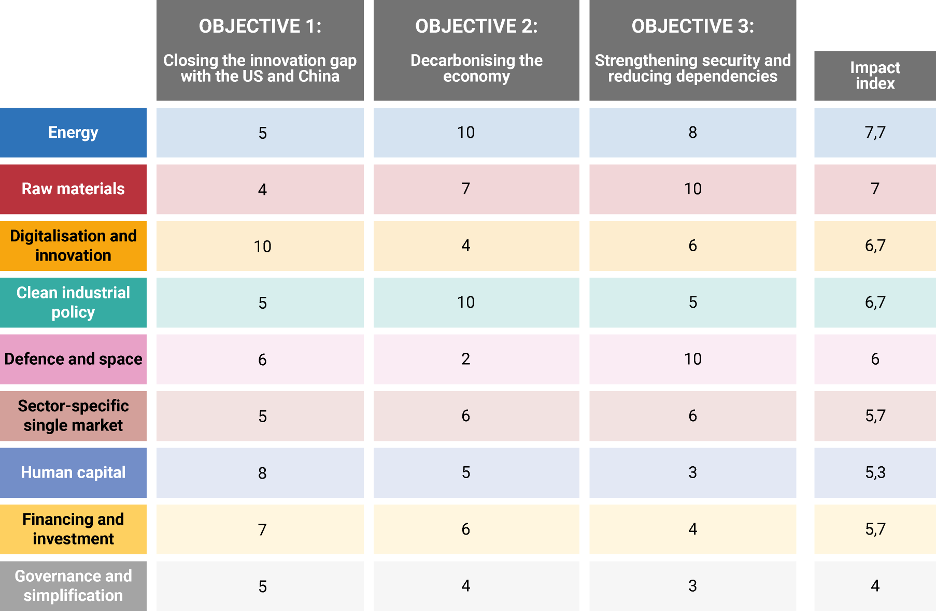
- Table 1 links each pillar to its estimated transformative impact, assessing its contribution to the three broad objectives identified in the Report: 1) closing the innovation gap with the United States and China; 2) decarbonising the economy; and 3) strengthening security and reducing dependencies.
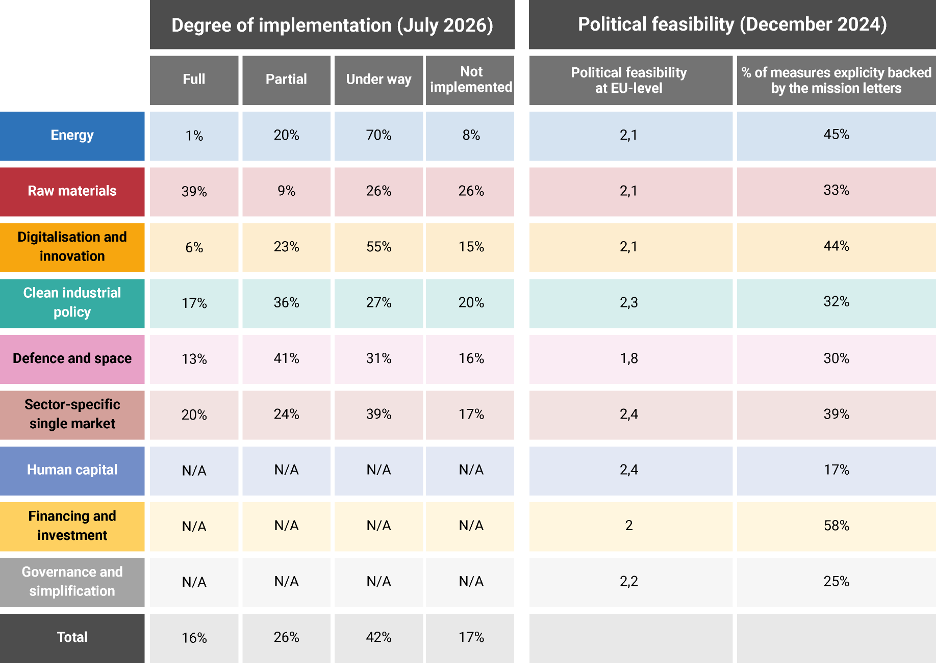
- Table 2 analyses, for each pillar, both the degree of implementation of the measures (as at July 2026) and their political feasibility (assessed at end-2024).
The notes to each table explain in detail how we estimate each pillar’s transformative impact, the progress made on reforms and their political feasibility.
Figure 1
THE DRAGHI REPORT’S NINE PILLARS AND NUMBER OF PROPOSED MEASURES (click on buttons for more details)
SOURCE: Devised by authors drawing on data from the Draghi Report (2024).
Table 1
TRANSFORMATIVE IMPACT OF THE STRATEGIC PILLARS
SOURCE: Devised by authors drawing on data from Elcano (2024), EPIC (2026) and the Draghi Report (2024).
NOTES:
The impact (0 to 10) is based on three elements:
(i) the direct links between each pillar and the Report's objectives, which act as anchor points (e.g. energy and industry with decarbonisation; digitalisation with innovation, defence and raw materials with security);
(ii) the measure importance index, prepared by experts from EPIC, available only for sectoral policies;
(iii) other qualitative and quantitative sources, including analyses by the Banco de España, Bruegel, Centre for European Policy Studies and Funcas
-Each pillar is scored according to its contribution to the three objectives, each carrying an equal weight (33% each).
Main findings: uneven progress, driven by shared urgency
Two years after the Report was published, our analysis points to a clear conclusion: the Draghi agenda is moving forward, but progress is highly uneven. Moreover, progress is not always seen in the most transformative reforms or in those that appear more feasible. In many cases, the proposals’ ambition still runs ahead of the political and practical capacity to deliver them.
The Draghi Report’s proposals are moving forward at a highly uneven pace, and not always where reforms are most transformative or easiest to approve
This gap between intentions and outcomes becomes apparent when looking at the sectoral measures tracked by EPIC in aggregate terms. As Table 2 shows, the largest category consists of measures that are under way (42%). These are backed by political commitment, but no binding rule or operational instrument is yet in force. Fully or partially implemented measures account for 16% and 26%, respectively. The gap between institutional activity and effective progress is itself a symptom of the EU’s longstanding coordination challenges. Declared political intent does not always translate into actual progress.
Table 2
DEGREE OF IMPLEMENTATION AND POLITICAL FEASIBILITY OF EACH PILLAR
SOURCE: Devised by authors drawing on Elcano (2024) and EPIC (2026).
NOTES:
-Implementation: the measuress in each pillar are divided into four groups: partial implementation, full implementation, under way and not implemented. Implementation data are only available for the six pillars covered by EPIC (energy, raw materials, digitalisation, industrial policy, defence and single market).
-Political feasibility: based on analysts' assessment of several factors: political resistance within the Council, need for unanimous agreement or qualified majority, and pressure from lobbies. The score is the simple average of the scores allocated to each measure using a scale of 1 to 3, where the highest values indicate fewer obstacles to adoption at EU-level.
-Mission indicator: shows the percentage of measures explicitly backed by the mission letters to the Commissioners-designate (2024–2029). Due to insufficient data, the “Digitalisation and innovation” pillar refers only to the measures included in Chapter 3 of the Draghi Report.
What explains the uneven pace of implementation?
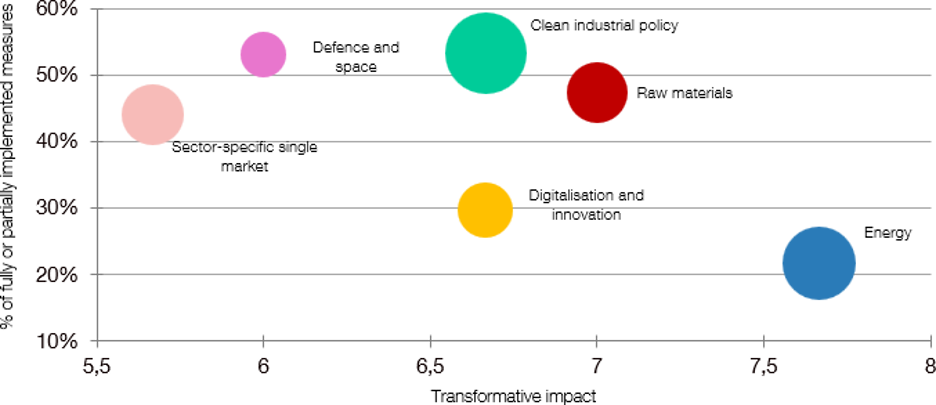
First, there is no clear link between a pillar’s transformative potential and the pace of implementation. If anything, Chart 1 suggests the opposite. Energy and critical raw materials are the pillars with the highest transformative impact. Yet, as Table 2 shows, their progress has diverged sharply: nearly 40% of the measures in the critical raw materials pillar have been implemented, whereas the figure for energy barely exceeds 1%, the lowest across all the pillars analysed.
Chart 1
TRANSFORMATIVE IMPACT AND DEGREE OF IMPLEMENTANTION OF THE DRAGHI REPORT'S PILLARS AT JULY 2026
SOURCES: Devised by authors drawing on data from Elcano (2024), EPIC (2026) and the Draghi Report (2024).
NOTE: The size of each bubble is directly proportional to the number of measures included under each pillar.
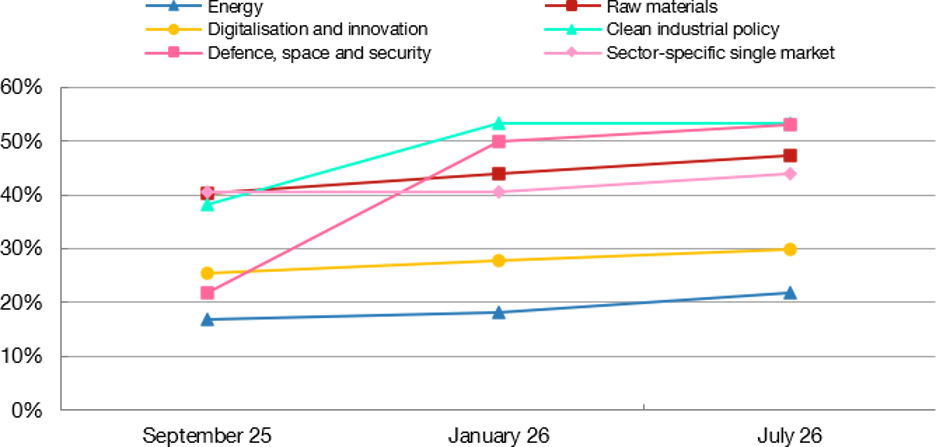
Second, initial political feasibility is a poor guide to which reforms will move fastest. Defence is the clearest example. In December 2024, the Elcano analysis identified defence as the most complex area for reform, reflecting resistance to a stronger European defence framework. Yet, a year and a half later, it has become one of the pillars with the greatest progress, as Chart 2 shows. Partially or fully implemented measures rose from 22% to 53% between September 2025 and July 2026, driven by the uncertainty over the Trump Administration’s commitment to European defence and NATO. The shift in the political context, and the resulting sense of urgency it created, have moved commitments forward much faster than the initial political landscape would have suggested.
Chart 2
PACE OF IMPLEMENTATION (% OF FULLY OR PARTIALLY IMPLEMENTED MEASURES)
SOURCE: Devised by authors drawing on EPIC data (2026).
The limited political capacity to turn feasibility into implementation can also be observed in other pillars for which direct data are not available, such as human capital and governance. While both are essential for European growth and for unlocking far-reaching reforms, they feature only marginally among Europe's political priorities. This is partly because they do not generate the same sense of urgency as areas such as defence or critical raw materials.
Human capital is a particularly telling case. Although it ranks among the pillars with the highest political feasibility, it is the least frequently mentioned in the mission letters that President Von der Leyen sent to her commissioners setting out the roadmap to 2029 (it is explicitly referred to in just 17% of them), as shown in Table 2.
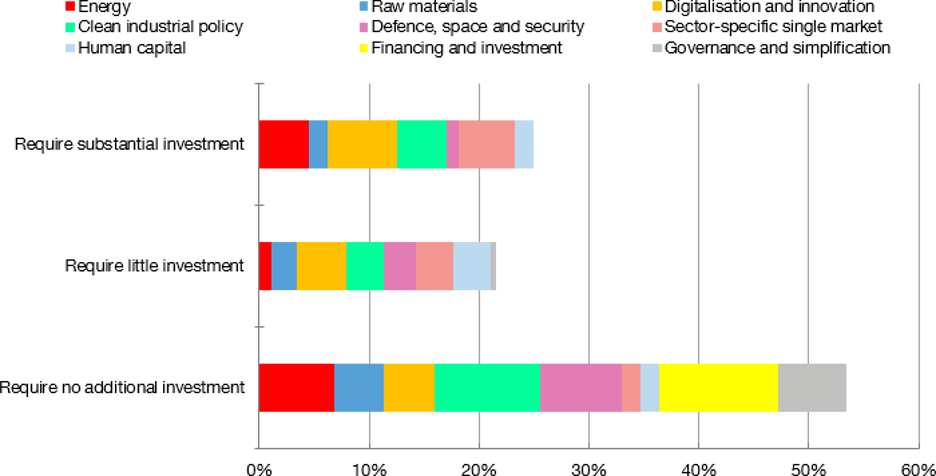
So, if the pace of reform is not determined by potential impact or initial political feasibility, the obvious question is: are resources the constraint? The answer is no. Chart 3 shows that a sizeable part of the Draghi agenda does not require additional resources: 53% of the 176 proposals do not call for new public investment. In other words, there is scope to move ahead without increasing public spending. When it comes to regulatory simplification, for instance, 92% of measures require no investment. In financing and competition, that figure reaches 100%. In many cases, progress depends less on new spending than on regulatory change and institutional coordination.
Chart 3
ADDITIONAL PUBLIC INVESTMENT NEEDED FOR EACH PILLAR (% OF PROPOSALS)
SOURCE: Devised by authors drawing on Elcano data (2024).
This does not mean the fiscal constraints can be overlooked. The additional investment called for by the agenda, estimated originally at around €800 billion per year, has been revised upwards to €1.2 trillion after including defence and remains a major challenge in some of the pillars, such as digitalisation and the sector-specific single market. But in most areas, the main obstacle is still getting the 27 Member States to agree, rather than finding the funding.
Two years on, the Draghi Report has not been left on the shelf, but the actual pace of implementation looks very different from what might have been expected in September 2024. The agenda moves forward where there is a shared sense of urgency (as in critical raw materials or defence, and as has been the case in every European crisis). Where there are only good intentions, as in energy and digitalisation, the agenda loses momentum.
The Draghi agenda is advancing in the familiar pattern of European integration: it is pressing necessity that drives major change
Draghi himself captured the underlying problem in the quotation that opens this post: the issue is not so much which reforms are more transformative, more politically feasible or more costly, but how much of the original ambition survives the process of turning it into an agreement, a regulation or a directive capable of reconciling the interests of the 27 Member States. Thus, nothing new under the European sun.

DISCLAIMER: The views expressed in this blog post are those of the author(s) and do not necessarily coincide with those of the Banco de España or the Eurosystem.