Spain’s trade with the United States and the impact of US tariffs
The United States is the sixth-largest market for Spain’s goods exports. While tariffs are expected to have a negative impact on the Spanish economy, this effect will likely be smaller than in the broader euro area, as Spain has less direct trade exposure to the United States and its bilateral trade is more geared towards services than that of the euro area.
The United States’ decision to raise tariffs is set to affect trade in goods with this country and could reverberate across the global economy. Spain is part of the European Union, which operates as a customs union![]() . This means that the tariffs agreed on 27 July will apply equally to all Member States. However, the impact will vary across countries depending on their reliance on bilateral trade with the United States and the types of goods each country exports. This post explores trade relations between the United States and both Spain and the broader euro area – and why the impact of these tariffs on the Spanish economy may be smaller than on other European economies.
. This means that the tariffs agreed on 27 July will apply equally to all Member States. However, the impact will vary across countries depending on their reliance on bilateral trade with the United States and the types of goods each country exports. This post explores trade relations between the United States and both Spain and the broader euro area – and why the impact of these tariffs on the Spanish economy may be smaller than on other European economies.
How has Spain’s balance of trade with the US changed in recent years?
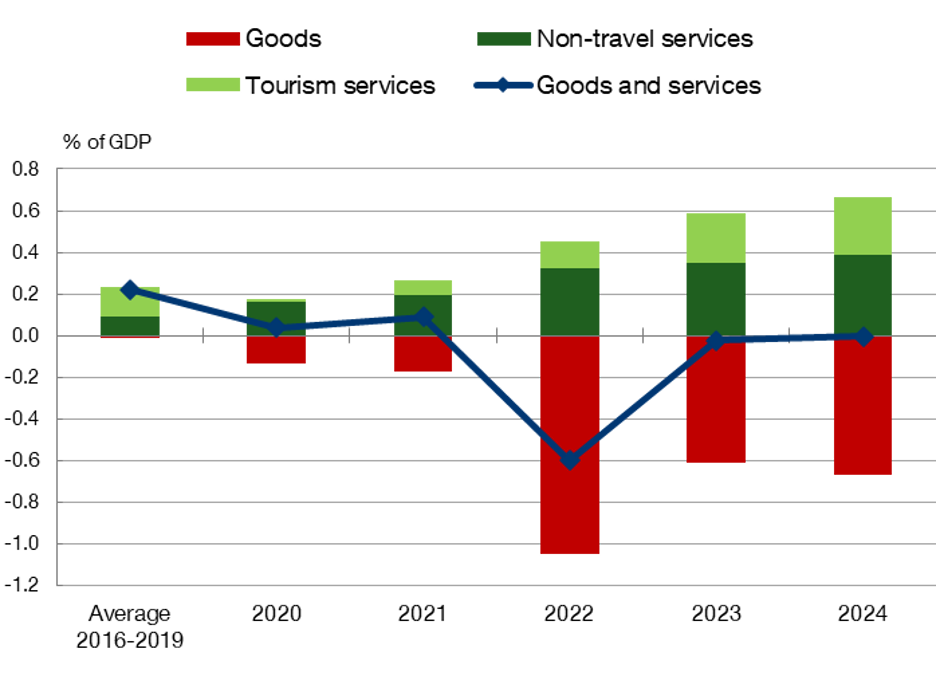
Between 2016 and 2019 Spain had a trade surplus with the United States of 0.2% of annual GDP. In 2022 this gave way to a deficit of 0.6% of GDP, which subsequently fell to almost zero in 2024 (0.003%), as shown in Chart 1.
DID YOU KNOW …?
The trade balance is the difference between a country’s exports and its imports. It is the sum of the goods balance and the services balance. The latter comprises travel services (tourism) and non-travel services, which include transportation, insurance and financial services.
The Banco de España calculates Spain’s trade balance as part of the balance of payments, using external trade data from the tax authorities’ Customs Department![]() , various surveys (EGATUR
, various surveys (EGATUR![]() , ETR
, ETR![]() and ECIS
and ECIS![]() ), information on card payments abroad and other estimates from the National Statistics Institute (INE
), information on card payments abroad and other estimates from the National Statistics Institute (INE![]() ).
).
Chart 1
SPAIN'S TRADE BALANCE WITH THE UNITED STATES IN RECENT YEARS
SOURCE: Banco de España.
While trade in services has seen a growing surplus, which exceeded 0.7% of GDP in 2024, trade in goods has steadily deteriorated, recording deficits since 2020 that have further widened in the past three years.
Figure 1 summarises Spain-US bilateral trade. In 2024, Spain’s total trade in goods and services with the United States represented 4.4% of GDP (with exports and imports representing around 2.2% each).
Figure 1 (interactive)
BILATERAL TRADE BETWEEN SPAIN AND THE UNITED STATES IN 2024
SOURCE: Banco de España.
NOTES: The figures are expressed as a percentage of Spanish GDP. T= Travel services (tourism); NT= Non-travel services.
Spain’s goods exports to the United States amounted to 1% of GDP (€16,168 million), while its imports of US goods amounted to 1.7% of Spanish GDP (€26,779 million). The United States is the sixth-biggest market for Spanish goods exports (accounting for 4% of total exports) and the fifth-biggest supplier of Spanish imports (accounting for 6% of total imports)
Services exports from Spain to the United States represented 1.2% of GDP (€19,042 million), compared with 0.5% in the case of imports (€8,472 million), thus resulting in a trade surplus. The United States is the fourth-largest market for Spain’s services exports and the third-largest supplier of services imports. Non-travel services accounted for the bulk of services exports (68%) and services imports (80%), mainly in the sectors listed in Figure 1.
DID YOU KNOW …?
As in other European countries, trade in non-travel services with the United States is largely channelled through multinationals and large corporations with links between the two countries. Drawing on data from the INE’s STEC![]() survey:
survey:
- 30% of services exports and almost half of services imports in 2022 flowed through Spanish firms belonging to groups under foreign control.
-These firms are concentrated in the information and communication, professional activities and transportation sectors.
Foreign direct investment (FDI) data reflect the importance of these links. In 2024 the United States was the second-largest recipient of Spanish FDI and the second-largest investor in Spain, behind the United Kingdom.
Moreover, many of the services provided by the US tech giants![]() (Google, Apple, etc.) are channelled through their Irish subsidiaries, meaning that the flow of services from the United States is likely greater than reflected by imports data.
(Google, Apple, etc.) are channelled through their Irish subsidiaries, meaning that the flow of services from the United States is likely greater than reflected by imports data.
Tourism exports to the United States (spending by US residents travelling to Spain) represented 0.4% of GDP (€6,148 million) in 2024, while tourism imports (Spanish residents travelling to the United States) amounted to 0.1% of GDP (€1,709 million). The United States is Spain’s fourth-largest source of tourism revenue and ranks sixth in terms of tourist arrivals.
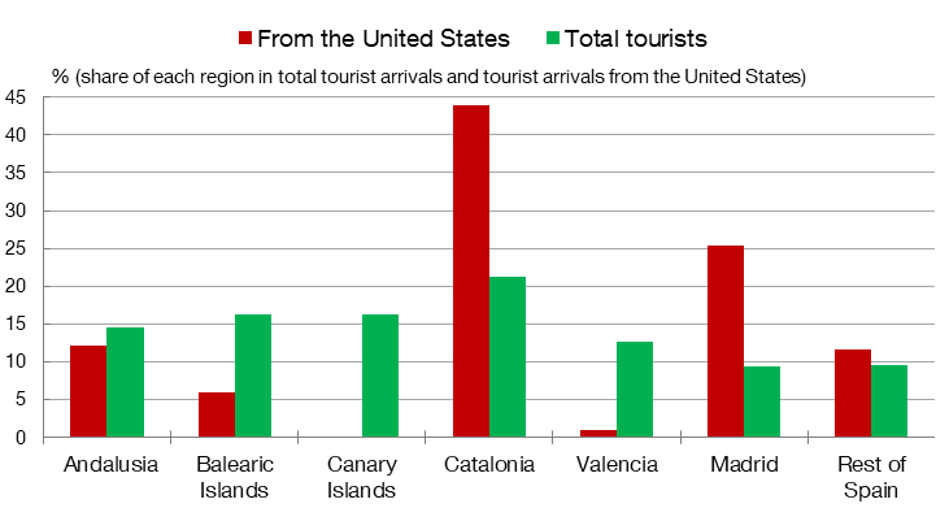
Over four million US tourists visited Spain in 2024![]() , a figure that has been steadily rising. These travellers now account for 5% of total arrivals. On average, US tourists spend more per trip than other tourists (€2,113 compared with €1,345) and stay longer (8 days compared with 7). As Chart 2 shows, they prefer mainland destinations (Catalonia, Madrid or Andalusia) and travel throughout the year – not just in summer.
, a figure that has been steadily rising. These travellers now account for 5% of total arrivals. On average, US tourists spend more per trip than other tourists (€2,113 compared with €1,345) and stay longer (8 days compared with 7). As Chart 2 shows, they prefer mainland destinations (Catalonia, Madrid or Andalusia) and travel throughout the year – not just in summer.
Chart 2
TOURIST ARRIVALS TO SPAIN IN 2024, BY REGION
SOURCE: INE.
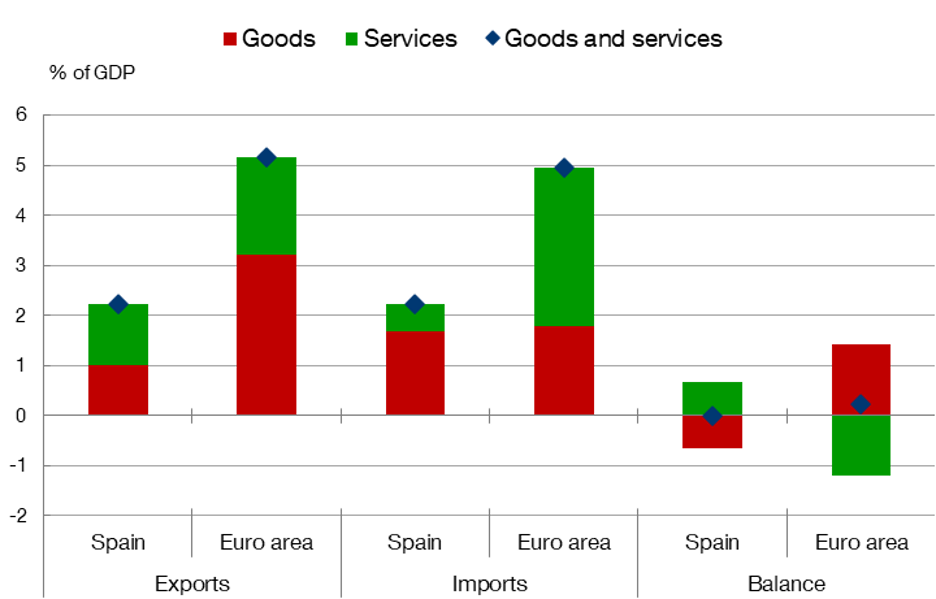
Compared with the broader euro area, Spain appears to have less direct trade exposure to the United States (Chart 3). Based on 2024 data, the main differences are as follows:
- Lower trade intensity: For the euro area, total trade with the United States amounts to 10.1% of GDP, more than double the figure for Spain (4.4%).
- A smaller share of external trade: The United States accounts for 6% of Spain’s exports and 7% of its imports, while for the euro area both figures are 10%.
- Compositional differences: In Spain, exports to the United States are predominantly services, while imports consist mainly of goods. Conversely, the euro area primarily exports goods and imports services.
- Similar trade balances, different compositions: The trade balance is close to equilibrium in both cases (virtually zero in Spain and +0.2% of GDP for the euro area), but the composition is reversed: Spain has a surplus in services and a deficit in goods, while the euro area runs a surplus in goods and a deficit in services.
In 2024, Spain’s trade with the United States represented 4.4% of its GDP, compared with 10.1% for the euro area. Spain's bilateral trade is also more geared towards services than Europe’s
Chart 3
TRADE BALANCE WITH THE UNITED STATES IN 2024
SOURCES: Banco de España and Eurostat.
How might the tariffs affect trade and the economy?
Higher US tariffs on Spanish and European goods exports would hurt bilateral trade, but they would also affect trade with other countries:
- There would be a direct impact on the exports of the affected sectors. As the exported products become more expensive in the destination market, demand for them falls;
- Because of global value chains, there would also be indirect effects such as lower demand for the components (e.g. car parts) that Spain exports to the euro area for use in goods subsequently exported to the United States;
- Trade in services would be impacted through its links with trade in goods (e.g. international freight transport) and by potential negative effects on tourism stemming from exchange rates (the dollar has depreciated considerably) and uncertainty.
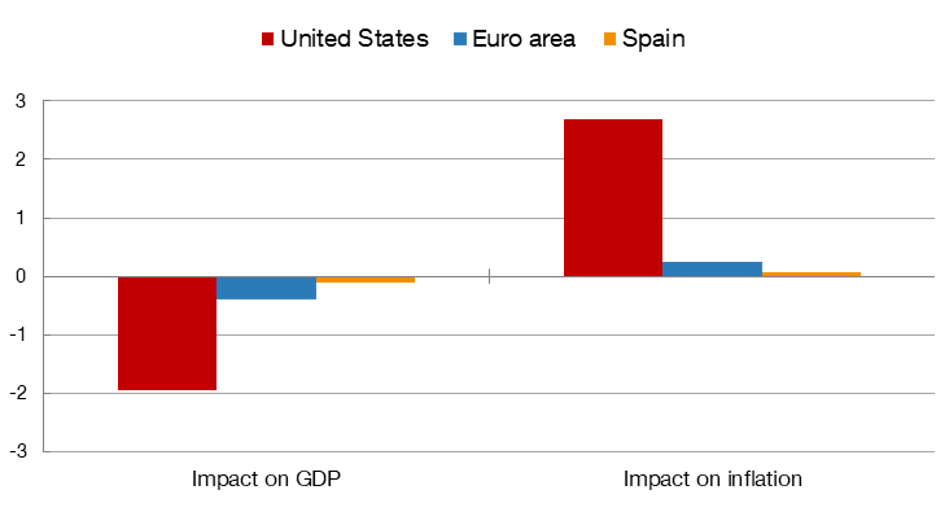
To understand the impact of the US tariffs on economic activity, we must consider how the different sectors contribute to trade with the United States. Chart 4 shows the macroeconomic impact of a blanket 10% US tariff on all goods imports (except energy products), drawing on a recent Banco de España![]() analysis included in our Annual Report 2024
analysis included in our Annual Report 2024![]() .
.
Chart 4
IMPACT OF A BLANKET 10% US TARIFF ON THE REST OF THE WORLD
SOURCES: Banco de España and Aguilar, Domínguez-Díaz, Gallegos and Quintana (2025)![]()
NOTE: The impact on GDP is the average of the outcomes of the NiGEM and multi-sectoral models for the three years following the tariff increase by the United States. A blanket 10% tariff is considered for all countries, with no exceptions and without accounting for any potential responses by other countries, tariff escalations, other effects on financial markets or uncertainty. For more details and the impact of these other effects, see Aguilar, Domínguez-Díaz, Gallegos and Quintana (2025)![]() .
.
Although the tariffs would apply uniformly across the region, the drop in GDP would be four times greater for the broader euro area than for Spain. Inflation, on the other hand, is estimated to rise only very slightly in both cases, with Spain again less affected. However, these negative effects pale in comparison with those estimated for the United States.
Spain’s GDP would be less affected by the tariffs than the euro area’s, although the impact will ultimately depend on the products affected and other indirect impacts
It is important to note that this exercise is incomplete. It does not account for the variation in tariffs across products (such as the higher 50% rate on aluminium and steel), nor for potential retaliatory measures between countries (which are, however, detailed in the above-mentioned analysis) or other trade disruptions triggered by the tariff escalation.
Even so, the results suggest that the impact could be significant, albeit highly uneven across countries and sectors.


DISCLAIMER: The views expressed in this blog post are those of the author(s) and do not necessarily coincide with those of the Banco de España or the Eurosystem.