Neither unemployed nor economically inactive: How AI is helping to measure labour market attachment in Spain
Traditional labour market statistics say that if you’re not employed or unemployed, that is, actively seeking work, you’re outside the labour market. But reality is far more nuanced. A new measure of labour market attachment uses artificial intelligence to paint a more accurate picture of the labour market, helping policymakers design better employment strategies.
The debate about the health of Spain’s labour market never really ends – even when official unemployment figures appear encouraging. But does the unemployment rate really capture the scarcity or abundance of available labour? And are the traditional categories of “unemployed” and “economically inactive” capable of doing so? Or is it time to consider other more refined metrics? In this post we introduce an alternative indicator: the degree of labour market attachment among those not in employment, using the latest advances in artificial intelligence (AI). This tool provides a more accurate picture of the Spanish labour market and aligns more closely with trends observed in other economic indicators.
Unemployed or economically inactive: limitations of the binary classification
The traditional distinction between “unemployed” and “economically inactive” is in many ways overly restrictive, a statistical straitjacket that hides the true complexity of the labour market, as shown in Figure 1.
Figure 1
THE ATTACHMENT METRIC BEATS THE TRADITIONAL BINARY CLASSIFICATION (Click on the approaches to see their differences)
Source: Devised by authors.
NOTES: The working‑age population typically comprises individuals aged 16 to 64.
DID YOU KNOW ...?
- The unemployment rate measures the percentage of the labour force that is out of work. The labour force is the sum of the employed and the unemployed. The rest of the working-age population is classified as economically inactive.
- An unemployed person is defined as someone without a job, available to start working immediately and who has actively searched for work in the past four weeks.
- An economically inactive person does not have a job and is neither available for nor actively seeking work, and is therefore typically treated as outside the labour market.
But people without jobs can have very different degrees of connection to the labour market: some will be job-seeking more actively than others, wage expectations will vary and some will face personal constraints on their availability. Consider a few examples:
- Someone who is unemployed but has a reservation wage
 far above what employers are offering is unlikely to accept a job.
 - Someone who hasn’t looked for work in recent weeks (and is therefore considered economically inactive) might still accept an attractive job offer immediately.
- Many economically inactive persons, while not meeting the official definition of unemployed person, show clear interest in working or would likely start working right away if the opportunity presents itself.
In short, the binary unemployed/economically inactive classification does not take into account the different circumstances of the non-employed population, whose heterogeneity has been studied in numerous papers, particularly for the United States (see examples here![]() , here
, here![]() and here
and here![]() ).
).
The traditional distinction between the unemployed and the economically inactive overlooks the heterogeneity of the non-employed population
The data for Spain clearly illustrate the blurred line between the unemployed and the economically inactive: while an unemployed person has a 26% probability of finding a job, an economically inactive person has a probability of 11% – lower but far from negligible. Looking more closely, we find that certain inactive individuals – in particular, those not available to start working immediately – actually have a 33% chance of finding employment, which is higher than that of “officially” unemployed individuals.
This leads to a clear conclusion: employment status is not an on/off switch but a continuum of possibilities. There are unemployed people who are disconnected from the labour market and inactive individuals who in fact retain some attachment to it. What really matters is non-employed persons’ degree of attachment or actual connection to the labour market. In other words, their latent likelihood of taking up employment, regardless of how actively they are looking for a job or their reported willingness to work.
From rigid categories to a spectrum of probabilities
Our research![]() proposes an alternative: applying machine learning techniques to micro data from the Spanish Labour Force Survey (LFS)
proposes an alternative: applying machine learning techniques to micro data from the Spanish Labour Force Survey (LFS)![]() to measure the labour market attachment (LMA) of Spain’s non-employed population.
to measure the labour market attachment (LMA) of Spain’s non-employed population.
DID YOU KNOW ...?
Our measure of labour market attachment takes an empirical, probability-based approach. Instead of classifying each person as unemployed or inactive, we estimate a labour market connection probability:
- We draw on all available LFS data since 2005, using machine learning (a type of AI).
- We use over 200 LFS variables, including not only the traditional questions on job-seeking and availability, but also information on education, work experience, the last job held, reason for economic inactivity and status in the National Public Employment Service.
- The model learns to predict the probability that a person not in employment in a given quarter will be employed at some point during the following year. In particular, we use an L1-penalised logistic regression.
Chart 1
DISTRIBUTION OF THE POPULATION NOT IN EMPLOYMENT BY THEIR DEGREE OF ATTACHMENT
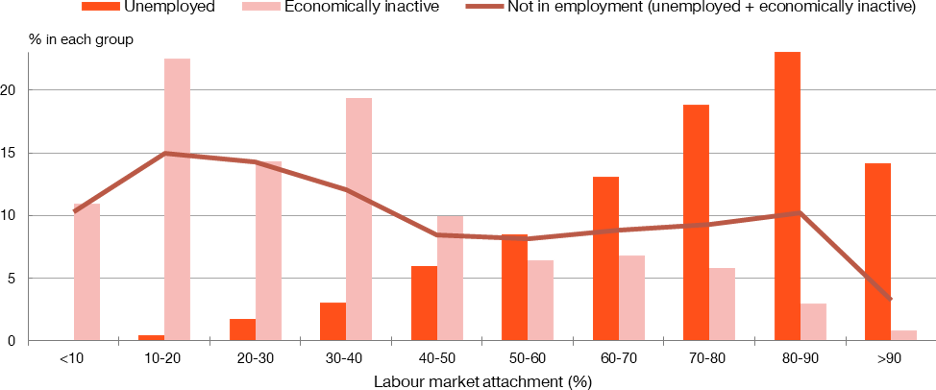
SOURCE: Authors' calculations, Labour Force Survey (LFS).
NOTES:
-The horizontal axis divides the reference population into ten groups by degree of labour market attachment, which can range from 0% (no attachment) to 100% (full attachment).
-Calculated based on LFS micro data for the period 2007 Q1-2023 Q1.
This tool generates an individual measure of labour market connection ranging between 0% (no attachment) and 100% (full attachment), which is updated every quarter, to capture labour market changes quickly and avoid seasonal distortions.
What the new indicator tells us
As Chart 1 shows, very few individuals display either full or zero attachment. Most fall somewhere in between – precisely where the traditional binary categories are most problematic.
Chart 1 also shows that, even though unemployed individuals generally have higher attachment, some exhibit low levels of connection. Similarly, some economically inactive persons display high attachment. This means that the traditional variables (active job-seeking and immediate availability), although relevant, are not the most decisive. True labour market attachment depends on many more factors, including:
- Recent experience: having recently lost a job is the strongest predictor of re-employment in the near term.
- Educational attainment level: individuals with higher education levels show significantly stronger attachment.
- Age: older people have a weaker connection to the labour market.
- Benefits and reservation wage: in some cases, benefits and subsidies raise the reservation wage so much that they effectively push some jobseekers away from the labour market.
Taken together, these results confirm that employability and reservation wage matter as much as – or even more than – active job-seeking in shaping labour market dynamics.
DID YOU KNOW...?
Our tool also reveals and measures the labour market connection of groups classified as economically inactive in official statistics:
- Students, who are traditionally considered to barely participate in the labour market. Our measure, however, shows significant attachment, especially when the economy is thriving, when many students have a high probability of taking up employment, reflecting their latent employability.
- People devoted to unpaid domestic tasks. In the LFS, their attachment is zero by definition. But our models reveal medium or even high levels of attachment, particularly during recessions. This is the well-know “second-earner effect”: when the main breadwinner loses their job, other household members are pushed to seek employment.
- Women. Our metrics show that many women classified as economically inactive have a stronger connection to employment than their reported job search suggests. This implies that the rise in women’s labour market participation in recent decades, while real, may have been less sudden than suggested by the figures, as some of them were already latently integrated into the labour force.
A better macroeconomic compass
Bearing in mind workers’ heterogeneity when measuring unemployment results in a better understanding of the macroeconomic cycle, as shown by several studies (here![]() and here
and here![]() )
)
Our measure of attachment captures that heterogeneity, to factor in economically inactive individuals with strong connections to the labour market and exclude some unemployed individuals with weak attachment. Based on these results, in Chart 2 we construct an "attachment rate", which is comparable to the unemployment rate and is calculated by dividing the non-working attached population by the sum of the non-working attached population and the employed population.
Chart 2
UNEMPLOYMENT RATE AND ATTACHMENT RATE IN SPAIN
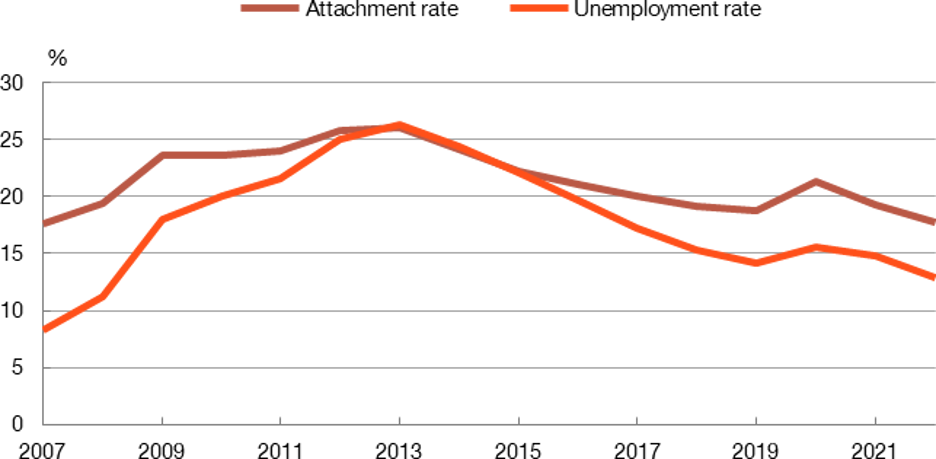
SOURCE: Authors’ calculations drawing on LFS micro data.
NOTES:
-The unemployment rate is defined as the percentage of unemployed people in the labour force (unemployed + employed).
-We define the attachment rate as the non-working attached population divided by the sum of the non-working attached population and the employed population.
This attachment rate is a strong predictor of employment developments and highly consistent with macroeconomic variables, clearly outperforming the traditional measures used to predict transitions into employment (see Chart 3). Our research also shows that the new metric is much more closely correlated with the economic cycle than the official unemployment rate.
Chart 3
FORECAST ERRORS FOR TRANSITIONS TO EMPLOYMENT ARE LOWER USING THE DEGREE OF ATTACHMENT
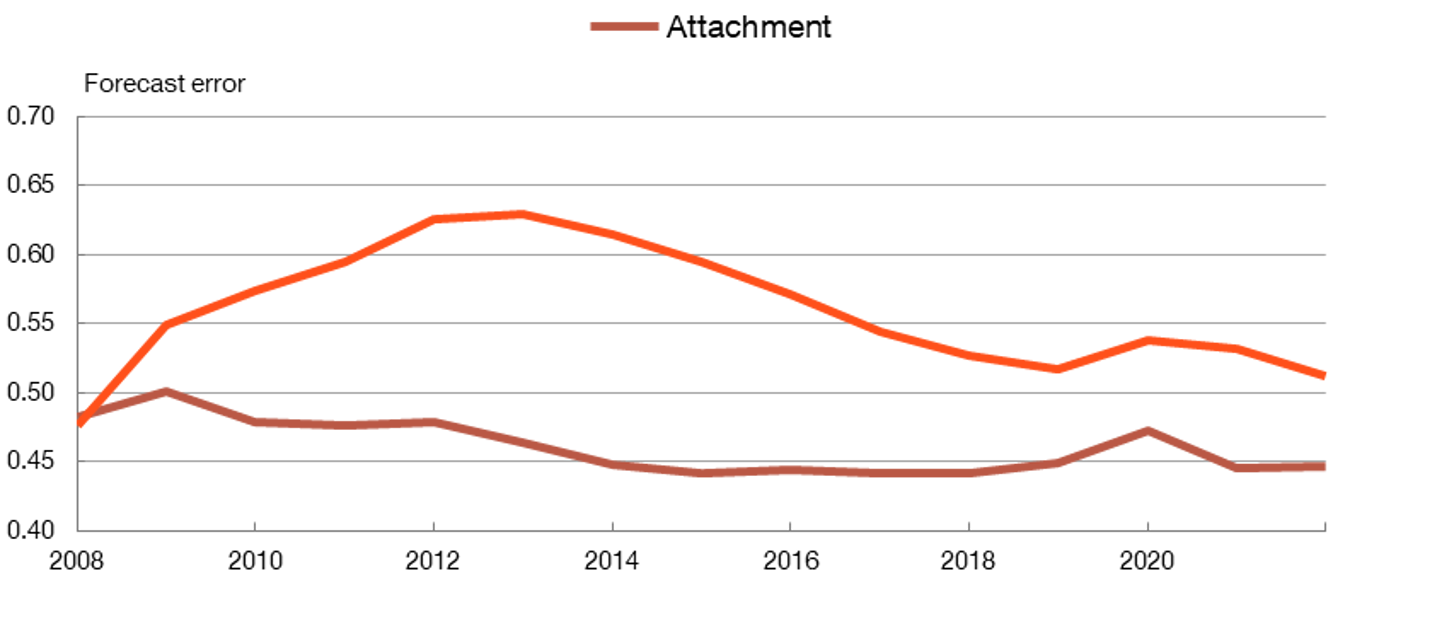
SOURCE: Authors’ calculations drawing on LFS micro data.
NOTES:
-The chart shows the average forecast error for each year and variable used (degree of attachment or economically inactive + unemployed) for transitions from non-employment to employment in the subsequent quarter.
-For the Attachment variable, each individual's degree of attachment (our measure of labour market connection) is taken directly as the predicted probability of return to employment.
-For the Unemployment/economically active variable, the unemployed are taken as those expected to transition from non-employment to employment and the economically inactive as those expected to remain in non-employment.
This finding has important implications. If the official metric does not correctly estimate labour market slack (how much of the potential labour force remains unused), policy responses may be misguided. Therefore, measuring labour market attachment more accurately is also a matter of economic policy. For example, precisely identifying individuals’ degree of attachment is essential for designing active labour market policies![]() .
.
If the official metric does not correctly estimate labour market slack, economic policies may end up being based on a mistaken diagnosis
Beyond the technical contribution, this approach invites a deeper discussion about the future of labour statistics. The boundary between unemployment and economic inactivity no longer reflects the reality of a labour market shaped by the continuously evolving interplay between availability, job-seeking and employability. It is time to move towards a more nuanced, probability-based and adaptive view of the labour market that more accurately measures how close a person is to returning to work. The debate remains open, but one thing is clear: analysing the labour market requires new metrics that acknowledge its heterogeneity. The combination of large-scale data and machine learning techniques could be a powerful tool for building them.


DISCLAIMER: The views expressed in this blog post are those of the author(s) and do not necessarily coincide with those of the Banco de España or the Eurosystem.