
Sovereign bonds, climate change and investment: what do the metrics say?
Climate change now plays a role in investment decisions. More and more investors are considering the environmental impact of the assets they buy. Government debt securities are no exception. Find out what a sovereign bond’s carbon footprint is, how it is calculated and why it matters.
More and more investors are factoring climate change into their investment decisions. They do so to gain a better understanding of the risks and opportunities arising from the transition to a lower-carbon economy. This applies not only to investments in firms, but also to government debt, and it is particularly important for long-term investors such as central banks.
But how is the carbon footprint of a sovereign bond measured? And which country or portfolio is the most polluting? We also examine the approach taken by central banks in managing their investment portfolios.
Why does climate change matter in finance?
Climate change can affect both the economy and financial markets. As a result, alongside the usual risks associated with an investment, many investors also assess climate-related risks. To do so, they look at sustainability criteria , i.e. environmental, social and governance (ESG) factors.
The financial risks associated with climate change – which also affect an investment portfolio or a specific investment instrument – are generally grouped into two categories:
- Physical risks: those arising from the increasing frequency and severity of extreme weather events or from gradual changes in the climate (e.g. floods, droughts and rising sea levels).
- Transition risks: those that emerge as the economy shifts towards a lower emissions economy (e.g. as a result of new regulations, technological advances or changes in consumer behaviour). These risks are linked to greenhouse gas emissions, which are typically measured in tonnes of carbon dioxide equivalent (CO₂e).
DID YOU KNOW ...?
The Kyoto Protocol covers seven main greenhouse gases (GHGs) (Figure 1). These gases matter because they trap heat in the atmosphere and contribute to global warming.
To allow different GHGs to be measured and compared on a consistent basis, emissions are converted into a common unit: tonnes of CO2 equivalente (CO2e). This makes it possible to calculate aggregate indicators that capture the climate impact of an individual, organisation, product or activity, whether directly through its own operations or indirectly through its consumption and supply chains
The most widely used of these indicators is the carbon footprint, which measures GHG emissions in relative terms and expresses them in kilograms or tonnes of CO2e, depending on the scale of the activity being measured.
Figure 1
THE KYOTO PROTOCOL COVERS SEVEN MAIN GHGs
SOURCE: Arranz, González and de Luis (2025), drawing on the GHG Protocol.
Assessing transition risks requires both high-quality emissions data and metrics that quantify how “green” or “polluting” an investment instrument is. In recent years, significant progress has been made in developing such metrics, although the focus has been mainly on corporate debt. Developing specific metrics to measure the climate footprint of sovereign bonds is particularly important for the portfolios of long-term institutional investors.
How is a sovereign bond’s carbon footprint measured?
Sovereign bonds are debt securities issued by governments. Calculating their carbon footprint involves three steps, as set out in Figure 2.
1. Calculating the emissions generated by the country issuing the bond (allocation), which can be done in three ways:
-
- Country or production-based approach: emissions generated within a country’s borders, including those linked to domestic consumption and exports.
- Consumption-based approach: emissions associated with domestic demand, including imports but excluding exports.
- Government-based approach: emissions associated with the central government.
2. Putting emissions into context (normalisation). A country’s emissions need to be expressed in comparable terms by relating them to variables such as the size of its economy, its population and its government spending. This makes it possible to compare countries with very different characteristics in a meaningful way.
3. Calculating the share of emissions financed by the investor (attribution). Each investor is assigned a share of the country’s emissions for which they can be considered responsible. This share is determined by the amount of that country’s debt held in the investor’s portfolio relative to the country’s overall capital structure, measured by the size of its economy or its total outstanding debt.
Figure 2
SOVEREIGN BOND POLLUTION, BY APPROACH
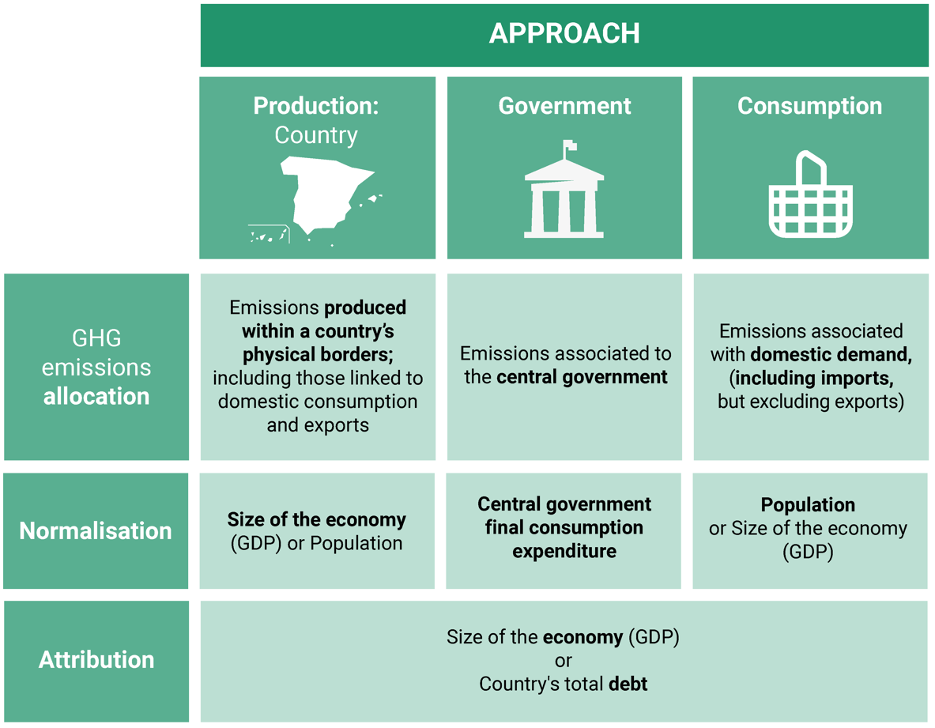
SOURCE: Arranz, González and de Luis (2025).
NOTE: Sovereign bonds are debt securities issued by central governments.
When normalising emissions and attributing emissions to investors by GDP, the calculations use GDP adjusted for purchasing power parity. This measure adjusts the value of economic output to reflect differences in countries’ costs of living and therefore their real purchasing power.
For normalisation purposes, territorial emissions (the production-based approach) are usually expressed relative to GDP, while consumption-based emissions are generally expressed on a per capita basis.
So which country or portfolio is the most polluting?
There is no single answer: the result depends on the methodology used.
A country’s productive structure and income level influence the level, path and measurement of its GHG emissions
GHG emissions can be measured from either a production-based or a consumption-based perspective, and the two approaches do not always produce the same results. This is because international trade causes part of the emissions associated with the production of goods and services to be allocated across different countries.
Broadly speaking, high-income economies consume more emissions-intensive goods and services than they produce within their borders. As a result, they typically appear more polluting under the consumption-based approach than under the production-based approach. By contrast, low-income countries tend to generate more emissions in the production of goods and services than those associated with their own consumption. In these countries the pattern is reversed, and their emissions footprint is smaller under the consumption-based approach (Chart 1). A similar pattern is observed for the lower-middle-income and upper-middle-income country groups, which are not shown in the chart.
Regardless of the methodology used, absolute emissions are much higher in high-income countries than in low-income countries, as Chart 1 shows.
Chart 1
A COUNTRY’S PRODUCTIVE STRUCTURE AND INCOME LEVEL INFLUENCE THE LEVEL, PATH AND MEASUREMENT OF ITS GHG EMISSIONS
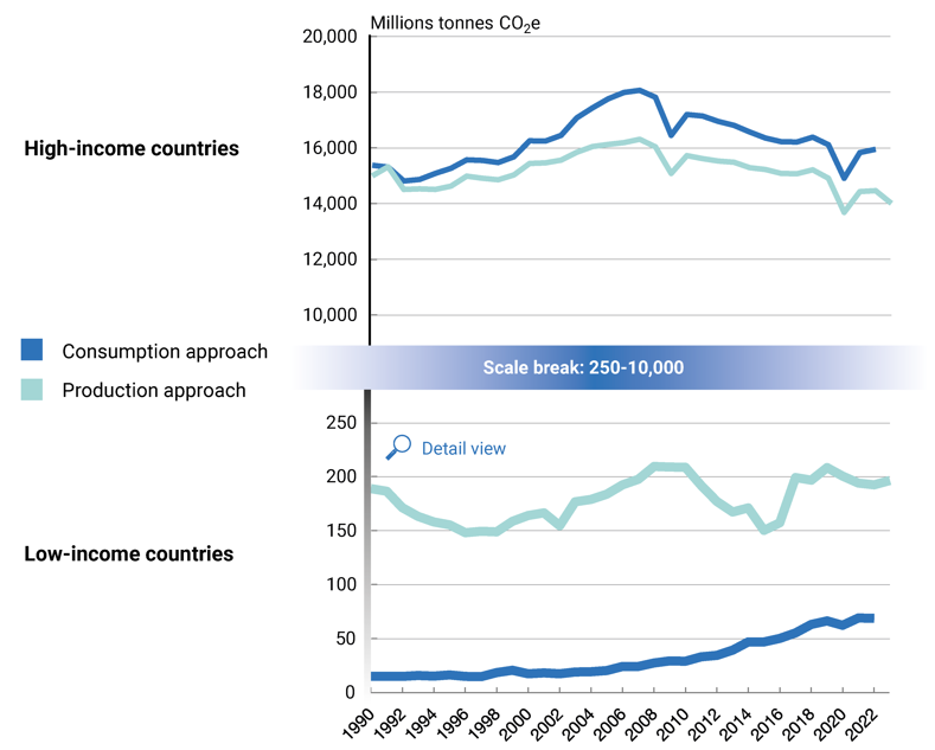
SOURCE: Arranz, González and de Luis (2025), drawing on data from Global Carbon Budget (2024) and Our World in Data.
NOTE: countries are grouped according to the World Bank income classification. Only high-income and low-income countries are shown; countries classified as upper-middle-income and lower-middle-income are excluded.
How polluting a country appears relative to its peers depends on how emissions are compared: relative to production or to population
The answer to the question of who pollutes the most also depends on how emissions are compared. Emissions can be expressed relative to the size of the economy or relative to the population, with each approach offering a different perspective. Because advanced economies tend to have higher GDP and relatively smaller populations, they typically appear more polluting when emissions are expressed on a per capita basis. Conversely, emerging economies often perform worse when emissions are measured relative to GDP. As a result, a country's position in pollution rankings can vary depending on which indicator is used (Chart 2).
Chart 2
HOW POLLUTING A COUNTRY APPEARS RELATIVE TO ITS PEERS DEPENDS ON WHETHER EMISSIONS ARE EXPRESSED RELATIVE TO GDP OR TO POPULATION
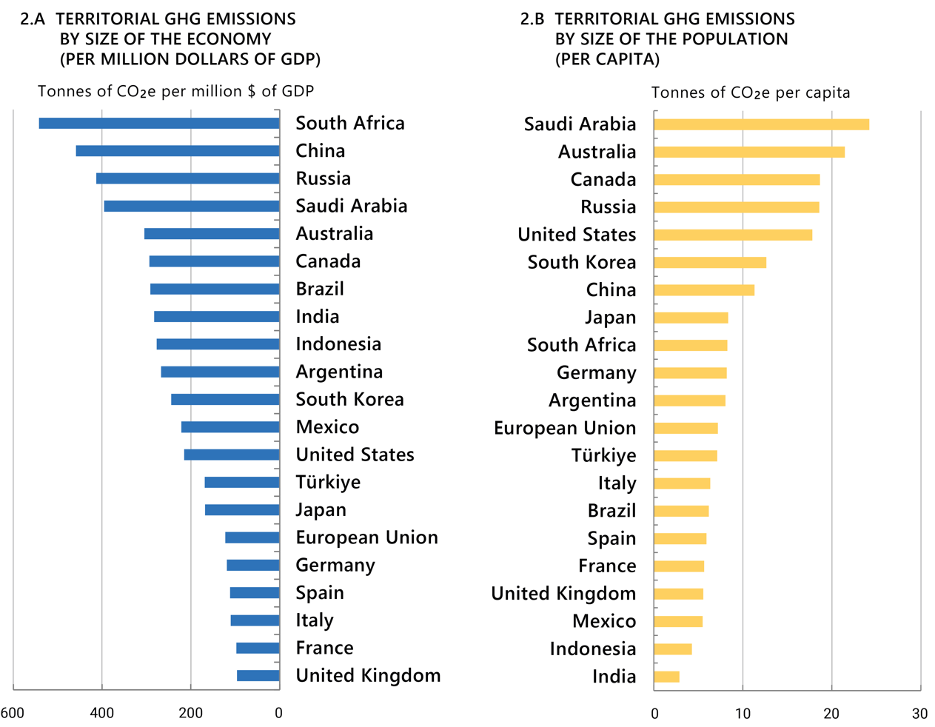
SOURCE: Arranz, González and de Luis (2025), drawing on World Bank data (EDGAR Database).
NOTE: G20 members plus Spain. GDP adjusted for purchasing power parity.
The same applies to investment portfolios. The carbon footprint attributed to an investor can vary depending on how emissions are allocated among debt holders. For instance, if a portfolio is invested in a country with a small economy and high government debt, the emissions attributed to the investor will be higher when measured relative to the size of the economy than relative to the level of government debt.
There is no single answer to the question of which country or portfolio is the most polluting, nor is there a single method for attributing a carbon footprint to investors
As we have seen, the climate metrics for sovereign assets each have their strengths and weaknesses and serve different purposes. Understanding how they are constructed is key to gauging their impact on asset portfolios and identifying opportunities. This, in turn, supports better investment decisions and helps monitor progress towards decarbonisation goals.
What about central banks' investment portfolios?
A growing number of central banks are taking sustainability factors into account when managing their investment portfolios. Further, in the interest of greater transparency, Eurosystem central banks and the European Central Bank regularly disclose information about the climate impact of their portfolios.
They do so using standard indicators such as the total CO2e emissions and carbon footprint of their investments. These metrics help track progress towards a lower-emissions economy, as well as alignment with the European Union’s climate goals and the Paris Agreement.
The Banco de España has applied sustainable and responsible investment principles to its own portfolios since 2019 and regularly publishes climate-related information on its investments. For sovereign debt holdings, changes in their carbon footprint are closely tied to the climate performance of the countries that issued the bonds. So, while the Banco de España factors climate criteria into its investment decisions and monitors these indicators transparently, any real progress in reducing the associated emissions largely depends on the policies and measures adopted by those countries to decarbonise their economies.
In conclusion, measuring the carbon footprint of sovereign bonds helps us better understand how climate change can affect investment in government debt. Although different calculation methods may suggest different interpretations, such metrics offer a transparent way to compare the transition risks associated with countries and portfolios. For central banks and long-term investors, these metrics are increasingly important for making informed decisions and leading by example in the transition towards a more sustainable economy.


DISCLAIMER: The views expressed in this blog post are those of the author(s) and do not necessarily coincide with those of the Banco de España or the Eurosystem.