

09/10/2026
Author: Banco de España
The stalemate in the Middle East conflict, after the US-Iran memorandum of understanding collapsed in July, and the increase in hostilities in recent weeks continue to keep the global economic environment exposed to a high level of uncertainty and volatility. In the period between the cut-off date for the assumptions underlying the last quarterly report (21 May) and that for this report (24 September), oil prices rose by 4% but remained below the baseline scenario in the June report. Natural gas prices, meanwhile, increased by 52% to levels slightly above those envisaged in the June report’s adverse scenario. These commodities have also displayed strong price fluctuations, influenced by developments in the conflict.
US trade policy continues to be marked by high uncertainty. This environment of uncertainty is the product of an import surcharge that was imposed temporarily (until July) to replace the “reciprocal tariffs”; the possibility of further tariffs following the US authorities’ investigation into excess capacity in certain manufacturing sectors of several economies, including the European Union; and trade tensions between the United States and Canada.
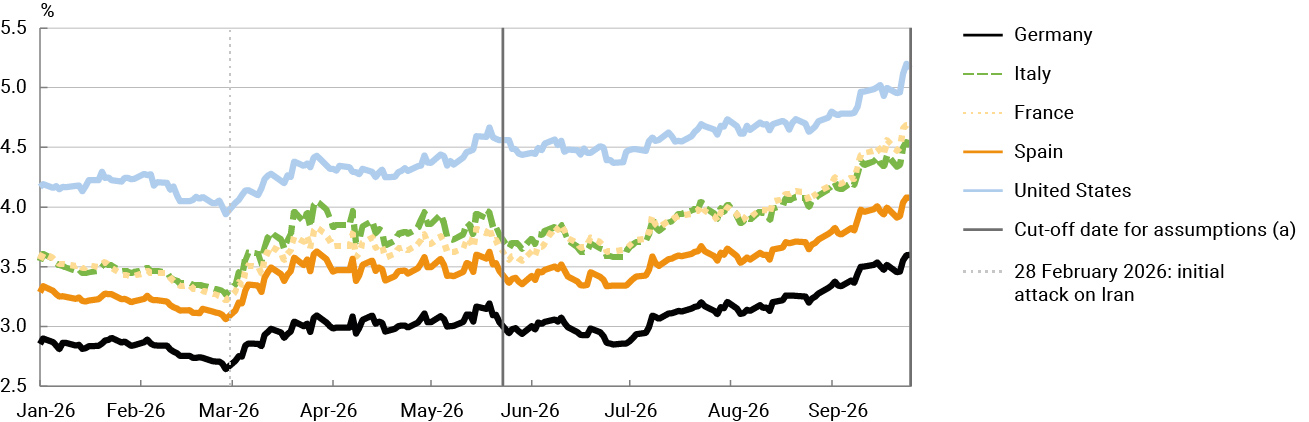
In the financial markets, long-term interest rates have risen sharply. Since the cut-off date for the assumptions underlying the last quarterly report, ten-year sovereign yields have increased by 63 basis points (bp) in the United States, 42 bp in the United Kingdom, 50 bp in Germany, 70 bp in Italy, 96 bp in France and 55 bp in Spain (Chart 1). This has been attributable to various factors, including a larger supply-demand imbalance in bonds associated with elevated public and private issuance volumes, increased monetary policy rate expectations and, to a lesser extent, higher compensation for inflation and, in some cases, for credit risk.
Chart 1 Ten-year sovereign debt yields
SOURCE: Bloomberg Data License.
21 May and 24 September for the June and 2026 Q3 Banco de España projection exercises, respectively.
Equities have recorded gains since the cut-off date for the assumptions underlying the last report. The S&P 500 rose by 3.5%, while the EURO STOXX and IBEX 35 increased by 8.9% and 3.3%, respectively, driven chiefly by strong corporate earnings. The Nasdaq 100 technology index climbed by 3.8%, underpinned by the revised growth outlook associated with artificial intelligence, although there were corrections in the semiconductor industry during the period under review. In the foreign exchange markets, the dollar appreciated against the euro (2.1%). This was in line with the widening US-euro area two-year interest rate differential, amid a sharper upward revision to monetary policy rate expectations in the case of the US economy.
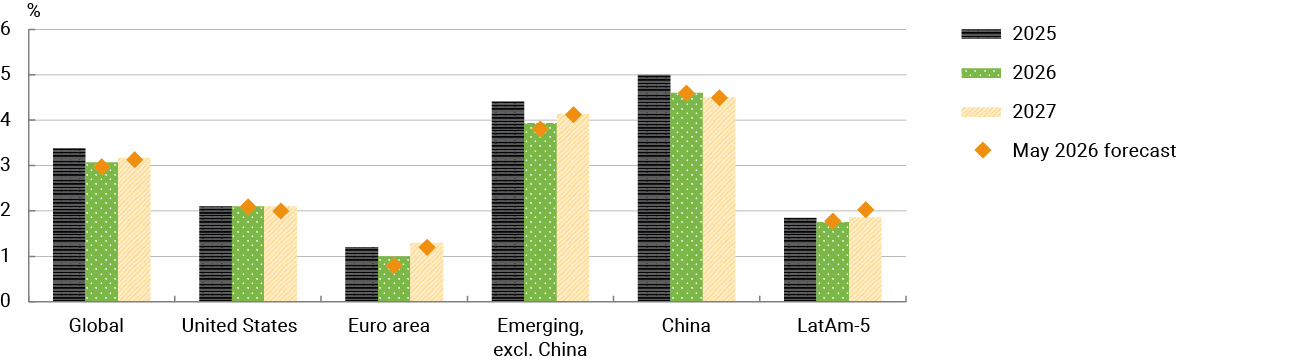
Despite the complex geopolitical environment, global economic activity has proven resilient to the energy shock. GDP growth in the United States and China slowed to quarter-on-quarter rates of 0.4% and 0.9%, respectively, in 2026 Q2. In the United States activity continued to be underpinned by domestic demand, with artificial intelligence-related investments proving particularly buoyant, while in China weak domestic demand was partially offset by momentum in the external sector. The latest indicators point to a strengthening of global growth in Q3. Accordingly, thanks to the resilience shown by the world economy in the first half of the year, the growth outlook for the global economy, the United States and China in 2026 remains practically unchanged from three months ago (Chart 2).
Chart 2 Consensus global economic growth forecasts (September 2026) (a)
SOURCE: Consensus Economics.
The September 2026 forecasts (bars) are compared with the May 2026 forecasts (diamonds). "LatAm-5" includes Mexico, Colombia, Peru, Chile and Brazil. "Emerging, excl. China" includes "LatAm-5", Argentina, India, Indonesia, Malaysia, Philippines, Thailand, Bulgaria, Hungary, Poland, Romania, Russia, Türkiye and Ukraine. Lastly, "Global" includes all the foregoing plus China, United States, Canada, Japan, Norway, Sweden, Switzerland, United Kingdom and "Euro area". The aggregates are calculated using GDP weightings in purchasing power parity terms.
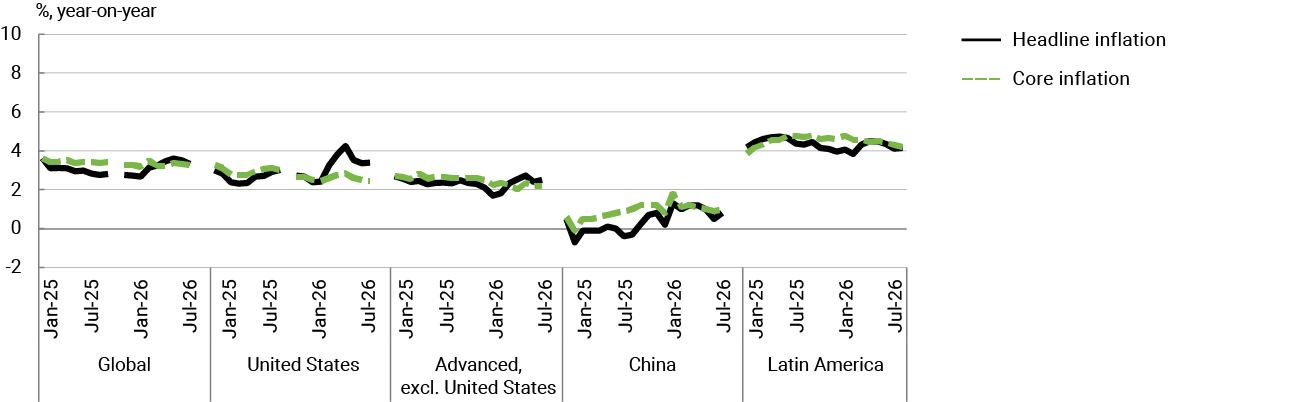
The energy shock has triggered a pick-up in global inflation. The rise in energy commodity prices has interrupted the global disinflation process, but its impact has varied across regions. The United States has been particularly affected by the shock: headline inflation rose from 2.4% in February to 4.2% in May before easing to 3.4% in August, although its core rate has been more subdued (Chart 3). By contrast, inflationary pressures remain low in China, whose headline rate stood at 0.8% in August.
Chart 3 Global inflation
SOURCES: National statistics and LSEG.
The price increases have led many central banks of the advanced economies to tighten their monetary policy stance. At their September meetings, both the US Federal Reserve System and the European Central Bank (ECB) raised policy rates by 25 bp, to 3.75%-4% and 2.5%, respectively. Given this situation, market expectations have moved towards higher interest rate paths than those priced in at the cut-off date for the last report. In the United States, the probability of a further interest rate hike in December and another in 2027 has strengthened. In the euro area, market expectations now point to further rate rises in 2027, compared with expectations of unchanged policy interest rates three months ago.
After stagnating in 2026 Q1, euro area GDP grew by 0.6% quarter-on-quarter in Q2, 0.4 percentage points (pp) more than the 0.2% expected in the June Eurosystem projection exercise. While a significant share of this upward surprise was attributable to Ireland’s high growth (10.2%), the main euro area economies also made a positive contribution, highlighting European economies’ resilience amid heightened global uncertainty and rising energy prices.
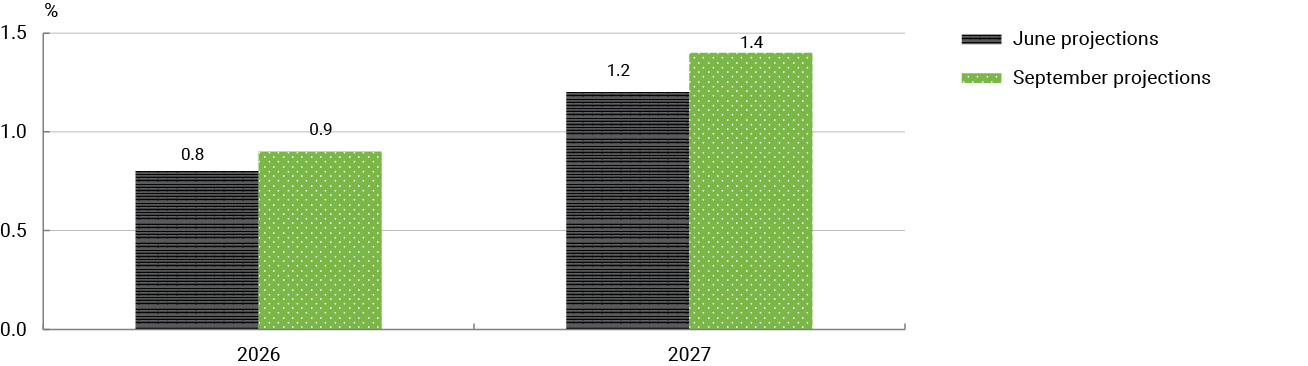
The September ECB staff macroeconomic projections foresee euro area GDP growth of 0.9% in 2026 and 1.4% in 2027, after the 1.3% expansion recorded in 2025 (Chart 4). Compared with the June Eurosystem staff exercise, these figures represent a slight upward revision for 2026 and 2027 (of 0.1 pp and 0.2 pp, respectively), owing to stronger economic activity in recent months. Given the persistently high level of uncertainty surrounding how the conflicts in Ukraine and the Middle East will unfold and their impact on the economy, the ECB has updated the three alternative scenarios contained in the June projections: a milder scenario (energy prices normalise more rapidly than in the baseline); an adverse scenario (greater energy-related tensions and higher uncertainty); and a severe scenario (a sharper and more persistent energy shock, giving rise to a stronger reaction of wages and non-energy prices). The impact on activity of these scenarios would be concentrated in 2027, with the ECB estimating GDP growth in that year of 1.5% under the milder scenario, 1.1% in the adverse scenario and 0.4% in the severe scenario.
Chart 4 Euro area GDP growth forecasts
SOURCES: Eurosystem and ECB.
Inflation in the euro area, as measured by the harmonised index of consumer prices (HICP), rose to 3.8% year-on-year in September, from 3% in April (the latest figure available at the cut-off date for the June Eurosystem staff projections). This was primarily driven by the acceleration in energy prices, whose growth rate increased from 10.8% in April to 18.8% in September. By contrast, food inflation continued to ease, falling from 2.4% to 1.1% in August, although it picked up to 1.4% in September. Core inflation rose slightly, from 2.2% to 2.5%, as a result of the faster price growth of non-energy industrial goods (up from 0.8% to 1.1%) and the acceleration in services inflation (from 3% in April to 3.2% in September).
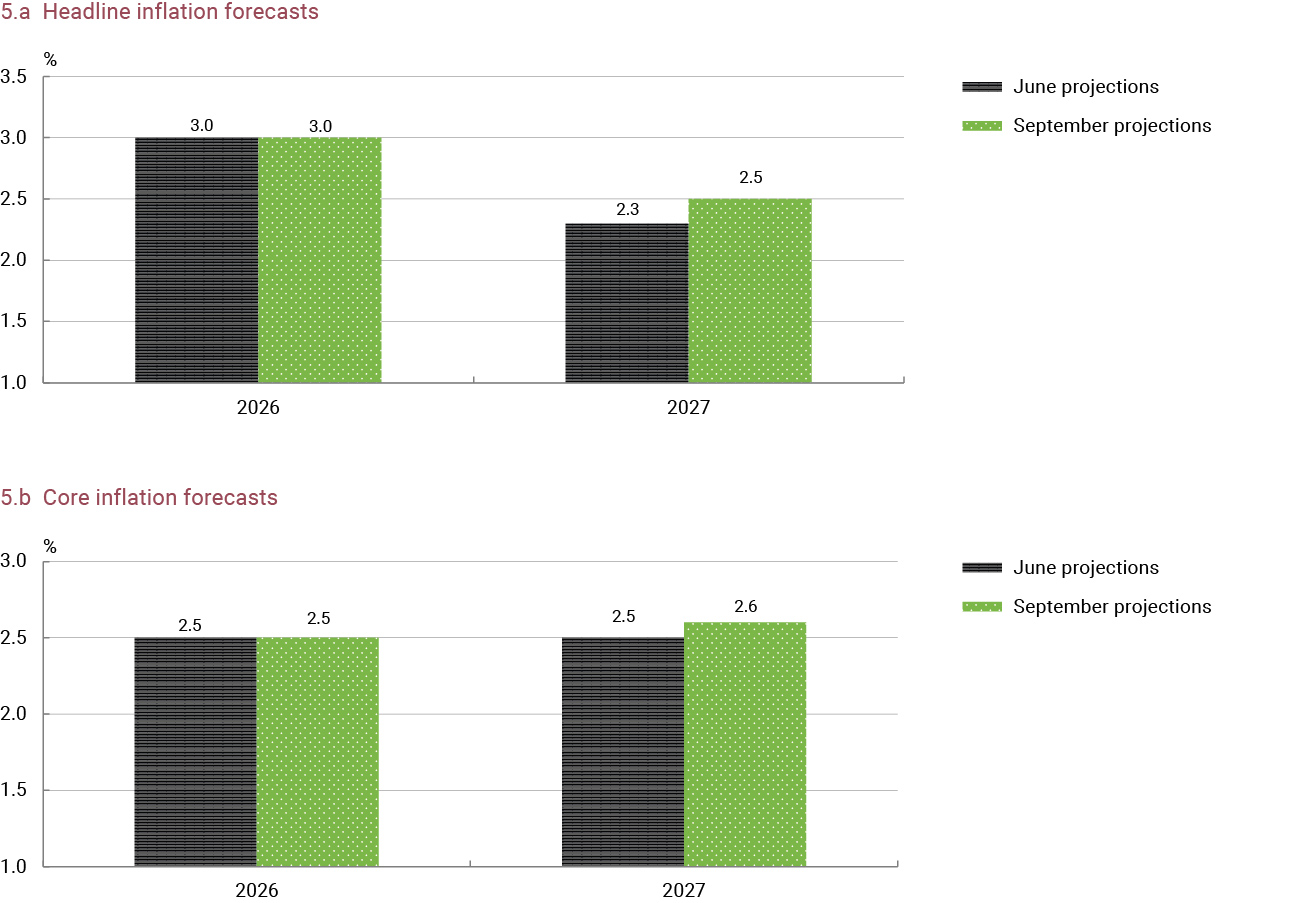
According to the latest ECB projections, inflation will remain above target for a prolonged period and core inflation will also stay at elevated levels. Consequently, in the September projections the outlook for headline inflation in 2026 is unchanged at 3% and revised up by 0.2 pp for 2027, to 2.5% (Chart 5.a). Meanwhile, core inflation is projected to remain steady at 2.5% in 2026, before rising to 2.6% in 2027 (Chart 5.b).
The ECB’s alternative scenarios suggest that a prolonged energy shock could lead to inflationary pressures proving significantly more persistent than under the baseline scenario. Specifically, headline inflation under the adverse scenario would stand at 3.1% in 2026 and 3.2% in 2027, and rise to 3.3% and 5.4%, respectively, under the severe scenario. Core inflation would also be higher in 2027, standing at 2.8% in the adverse scenario and 3.5% in the severe scenario.
Chart 5 Euro area inflation forecasts
SOURCES: Eurosystem and ECB.
After raising interest rates twice this year, the ECB Governing Council considers that it remains well positioned to navigate the uncertainty caused by geopolitical tensions and is committed to ensuring that inflation returns to its 2% target in the medium term. Consequently, it will continue to follow a data-dependent and meeting-by-meeting approach to its decisions, based on the inflation outlook, incoming economic and financial data, underlying inflation and the strength of monetary policy transmission. The ECB has also reiterated that it is not pre-committing to a particular rate path.
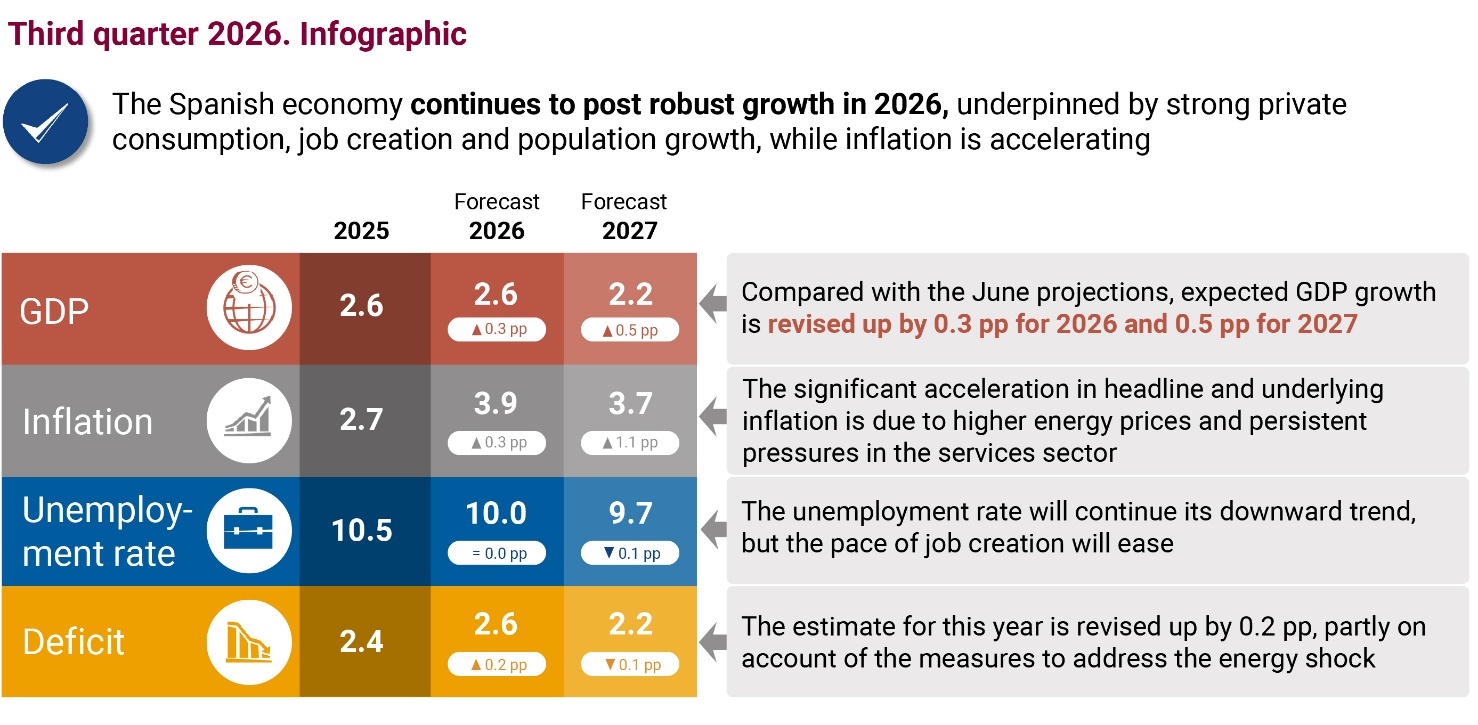
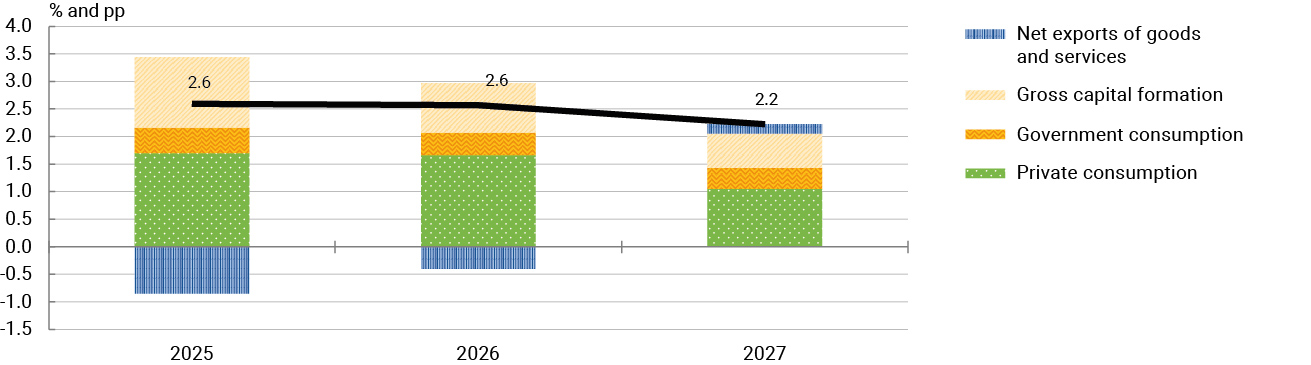
These projections for the Spanish economy envisage GDP growth of 2.6% in 2026 and 2.2% in 2027 (up 0.3 pp and 0.5 pp from the June projections) and inflation at 3.9% and 3.7%, respectively (0.3 pp and 1.1 pp more than expected in June) (Table 1). Despite the complex international environment and rising energy prices, the Spanish economy continues to enjoy significant momentum in 2026, underpinned by buoyant private consumption, job creation and population growth, such that GDP will likely grow in the year as a whole as in 2025. Nevertheless, energy market disruptions, rising goods prices and persistent inflationary pressures in the services sector appear to be driving a notable uptick in headline and underlying inflation in 2026, which are set to exceed 2025 levels by 1.2 pp and 0.8 pp, respectively. In 2027 the moderation of domestic demand will probably slow economic and employment growth and, along with the gradual fading of the energy shock, likely be conducive to a slowdown in inflation.
Table 1 Projections for the main macroeconomic aggregates of the Spanish economy (a)
| Annual rate of change in volume terms (%) and % of GDP | |||||
|---|---|---|---|---|---|
| 2026 Q3 projections |
Difference between the current projections and the June 2026 projections (b) | ||||
| 2025 | 2026 | 2027 | 2026 | 2027 | |
| GDP | 2.6 | 2.6 | 2.2 | 0.3 | 0.5 |
| Private consumption | 3.1 | 3.0 | 1.9 | 0.4 | 0.3 |
| Government consumption | 2.4 | 2.1 | 2.0 | 0.6 | 0.3 |
| Gross capital formation | 6.0 | 4.1 | 2.8 | 0.0 | 0.6 |
| Exports of goods and services | 2.6 | 2.4 | 3.4 | 1.6 | 0.8 |
| Imports of goods and services | 5.5 | 3.9 | 3.2 | 1.8 | 0.4 |
| Domestic demand (contribution to growth) | 3.4 | 3.0 | 2.0 | 0.3 | 0.3 |
| Net exports (contribution to growth) | -0.8 | -0.4 | 0.2 | 0.0 | 0.2 |
| Nominal GDP | 5.7 | 5.5 | 5.6 | 0.5 | 1.3 |
| GDP deflator | 3.0 | 2.9 | 3.3 | 0.2 | 0.8 |
| HICP | 2.7 | 3.9 | 3.7 | 0.3 | 1.1 |
| HICP excluding energy and food | 2.6 | 3.4 | 3.5 | 0.2 | 0.3 |
| Employment (persons) | 2.6 | 2.0 | 1.8 | -0.2 | 0.3 |
| Employment (hours) | 2.0 | 2.2 | 1.7 | 0.4 | 0.5 |
| Unemployment rate (% of labour force). Annual average | 10.5 | 10.0 | 9.7 | 0.0 | -0.1 |
| Net lending (+) / net borrowing (-) of the nation (% of GDP) | 4.3 | 3.4 | 3.0 | 0.3 | 0.4 |
| General government net lending (+) / net borrowing (-) (% of GDP) | -2.4 | -2.6 | -2.2 | -0.2 | 0.1 |
| General government debt (% of GDP) | 100.5 | 98.5 | 96.2 | -0.4 | -1.7 |
SOURCES: INE and Banco de España.
Projections cut-off date: 2 October 2026. Latest Quarterly National Accounts figure published: 2026 Q2.
Differences calculated based on figures rounded to one decimal place.
Despite the energy crisis, the Spanish economy continues to show striking resilience. In 2026 Q2 GDP rose by 0.7% in quarter-on-quarter terms, above the 0.6% of Q1 and the range of 0.5% to 0.6% envisaged in the previous projection exercise. This growth was based on robust domestic demand (private consumption and investment in particular), while external demand made a negative contribution to growth owing to the notable rise in imports. The short-term economic indicators available for Q3, such as the Banco de España Business Activity Survey (EBAE) (Box 1), point to economic growth of around 0.6%.
Robust activity in Q2 and a more favourable outlook for Q3 than envisaged in June underlie the upward revision to GDP growth in 2026 from 2.3% to 2.6%. The 2027 growth forecast has also been raised, from 1.7% to 2.2%, owing to the resilience of the Spanish economy and to activity in 2026 H2 being more robust than expected in the June projections. This momentum is set to carry over into 2027 and offset a somewhat less favourable global setting and monetary conditions, despite the upward revision to the expected performance of the Spanish economy’s external markets (Box 2).
Private consumption remains the main driver of activity, although it is expected to lose some momentum over the coming quarters (Chart 6). Household consumption remained notably buoyant in the first half of the year, supported by job creation, population growth, rising disposable income and favourable financing conditions. In the coming quarters, as some of these tailwinds gradually drop, consumption growth is expected to slow, falling from 3.1% in 2025 to 3.0% in 2026 and 1.9% in 2027.
Chart 6 GDP growth projections and contributions
SOURCES: INE and Banco de España.
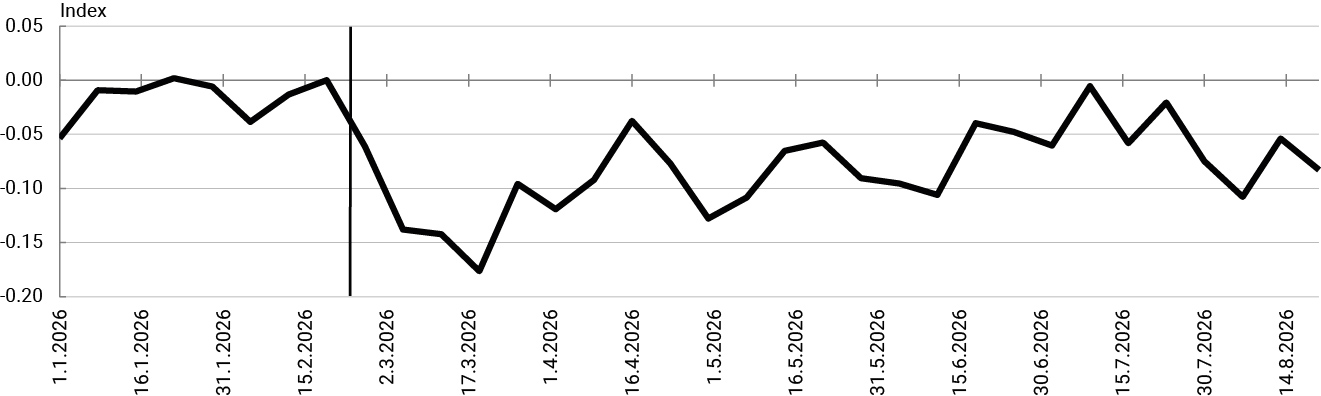
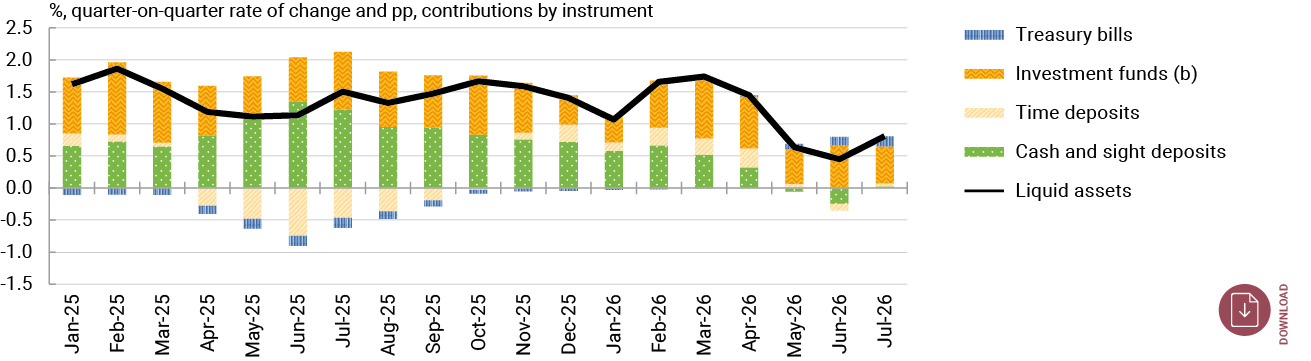
Household spending is expected to be supported over the projection horizon by several factors. First, consumer confidence has recovered some of the ground lost after the outbreak of the war in Iran, helped by a more favourable outlook for economic activity than prior to it (Chart 7). Second, consumer credit remains highly buoyant and is rising as a share of total lending to households. Consumer credit has grown at year-on-year rates of more than 10% since September 2025. In August 2026 it accounted for 16.9% of household borrowing, compared with an average of 15.7% in 2025. Third, the saving rate, which stood at 11% of disposable income in 2026 Q2, remains high and significantly above its historical average. These levels provide households with some headroom to dampen the impact of the inflationary shock and rising interest rates on real disposable income. In addition, households face the shock with debt and debt servicing ratios that are low by historical standards and from a strong financial position.1 As regards households’ financial position, although the pace of liquid asset accumulation has slowed, households have increasingly shifted their portfolio holdings towards instruments with higher yields, such as investment funds and Treasury bills (Chart 8).
Chart 7 Consumer confidence since the outbreak of the war in Iran (a) (b)
SOURCE: Consumer Expectations Survey (ECB).
The vertical line marks the outbreak of the conflict in Iran (late February 2026).
The index is based on four questions: (i) household finances over the past 12 months, (ii) households’ expected financial situation over the next 12 months, (iii) economic growth expectations for the next 12 months and (iv) plans to purchase big-ticket items over the next 12 months. Numerical values are assigned to the different responses to construct the index.
Chart 8 Changes in household liquid assets and their composition (a)
SOURCE: Banco de España.
Seasonally adjusted data. The quarter-on-quarter rate of change is calculated using the three-month cumulative net flow.
Net subscriptions (excluding valuation effects).
Productive investment grew strongly in 2026 H1. It was buoyed by robust growth in investment in capital goods, while the rise in investment in other construction slowed, after displaying significant momentum in 2025. Intangible investment also continued to grow briskly, extending a trend that began in 2019, with intangible assets rising by nearly 60% between 2019 and 2026 Q2. This strong growth contrasts with a modest increase (of around 7%) of investment in capital goods. As a result, the share of intangible assets in overall productive investment has grown from 23% in 2019 to close to 28% in 2026 Q2, while that of capital goods investment dropped from 44% to 38%.
In the coming quarters, investment in tangible assets will likely ease following its recent significant growth, while intangible investment is expected to remain buoyant. Surveys for Q3 point to a moderation in investment in machinery and transport equipment, in a context of tightening financial conditions (Box 1). Meanwhile, the significant slowdown in permits for non-residential buildings is consistent with investment in other construction easing towards the end of 2026. By contrast, intangible investment will likely remain more buoyant, in line with the growth in services business activity indices and recent developments in non-tourism services exports. Some factors could nevertheless weigh on investment decisions in the coming quarters. These include the end of the Next Generation EU programme and more expensive business credit, against a backdrop of tighter lending standards and weak demand for financing, according to the ECB’s Bank Lending Survey.
Residential investment continues to grow more slowly than expected due to persistent restrictions. The easing of the rise in residential investment in 2026 is consistent with the slower pace of building permit issuance, a drop in the completion rate of new builds, the uptick in input costs and the difficulties in connecting new developments to the electricity grid difficulties new developments face in securing access and connecting to the electricity grid. The rise in housing starts since 2024, together with developments in new bank lending for construction and real estate development activities, points to stronger growth in residential investment in 2027. That said, this outlook is constrained by persistent structural restrictions, including labour shortages,2 the slow pace of urban development and the limited availability of build-ready land.
Against a backdrop of strong demand and rising house prices, momentum in residential investment will depend on the responsiveness of supply. The sustained increase in real house prices reflects the widening gap between new housing production and net household formation that has built up since 2021. This housing shortage should drive stronger growth in residential investment over the projection horizon, although the current rigidity of the housing supply is hampering its expansion. Nevertheless, it is expected that better execution of the various public programmes for government-subsidised housing – promoted by central, regional and local governments – will further boost residential investment from 2027 onwards.
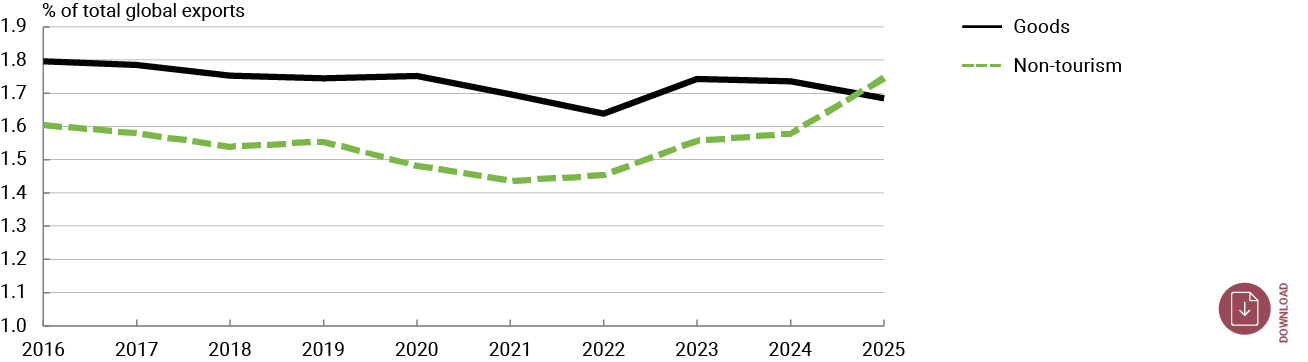
In the external sector, the favourable performance of services exports underpins the Spanish economy’s sizeable net lending position vis-à-vis the rest of the world. This position stood at 3.1% of GDP in 2026 Q2, above its pre-pandemic level (2.5% of GDP), although below the recent peak (4.3% in 2025). The current account posted a surplus of 2% of GDP in Q2, supported in particular by tourism and non-tourism services, whose exports have risen markedly since the pandemic. In 2026 Q2 the tourism surplus reached 4.8% of GDP and non-tourism services hit a new high at 2.6% of GDP (Chart 9). The trade deficit in goods has weighed on the external balance. Over the four quarters to June 2026, the goods deficit reached 3.4% of GDP, compared with 2.6% a year earlier, owing greatly to the widening of the non-energy goods deficit, from 0.7% to 1.5% of GDP. Despite the sharp rise in global energy prices, the energy deficit has narrowed gradually in recent quarters, falling from 2.0% of GDP in the four quarters to June 2025 to 1.9% in the four quarters to June 2026. On the financial side, Spain’s external surpluses have helped reduce its net debtor position vis-à-vis the rest of the world in recent years, although it remains high in comparison with European peers.3 In 2026 Q2, Spain’s negative net international investment position stood at 40.7% of GDP, broadly unchanged from the previous quarter, while gross external debt increased to 168.3% of GDP.
Chart 9 Spain’s share of global exports
SOURCES: IMF and WTO.
Looking ahead to the coming quarters, the upward revision to the growth expectations in export markets in 2026 H2 and 2027, together with the euro’s depreciation against the US dollar (Box 2), likely mean that momentum in the external sector will increase. This should help goods exports recover after their weak performance in 2026 H1, while the momentum seen in tourism exports and other services exports in recent years is expected to continue. Overall, exports of goods and services are projected to grow by 2.4% in 2026 and 3.4% in 2027, compared with 2.6% in 2025.
Imports will be supported by import-intensive components of demand, such as investment in capital goods. Even so, imports are expected to grow less strongly in 2026 and 2027 than in 2025, as their unusually high elasticity to final demand over the past two years eases to more normal levels. As such, import growth will slow from 5.5% in 2025 to 3.9% and 3.2% in 2026 and 2027, respectively. Overall, the external sector is expected to account for an increasing share of GDP growth over the projection horizon, as imports grow more slowly than in previous quarters and exports gain momentum. After trimming 0.8 pp from growth in 2025, the external sector’s contribution is projected to improve gradually over the projection horizon to stand at 0.2 pp in 2027 (Chart 6).
Recent employment data metrics have been affected by the exceptional scheme to regularise immigrants, making it harder to identify short-term signals. On a seasonally adjusted quarter-on-quarter basis, social security registrations accelerated sharply, rising to 1.3% in September from 0.5% in April, before the effects of the regularisation scheme began to feed through to the registration data. This rise reflects strong growth in registrations by foreign nationals, which increased by 17.7% year-on-year in September, with 421,306 people incorporated into the social security system as at 30 September 2026. However, some of those regularised may already have been in work, as in the case of some asylum seekers or people working in the shadow economy. For this reason, the social security registration data in Q3 provide a less precise picture of current labour market conditions than usual.
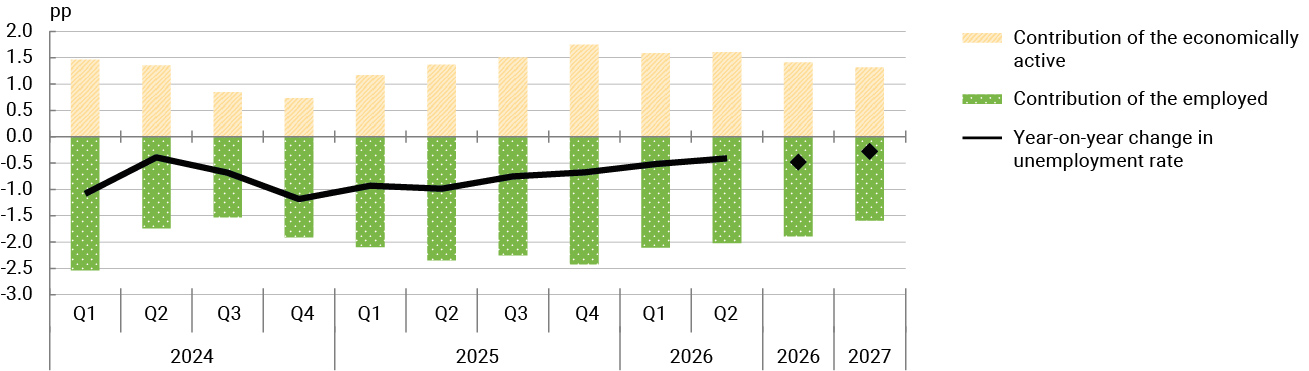
Meanwhile, the unemployment rate continued to decline, falling to 10.1% in 2026 Q2 on a seasonally adjusted basis, while labour supply continued to expand. The increase in labour market participation has been driven primarily by immigration and by rising participation among Spanish nationals aged over 45.
Looking ahead, employment growth is expected to continue, although it will slow over the projection horizon. After rising by 2.6% in 2025, the number of people employed is expected to grow more moderately in the years ahead, by 2.0% in 2026 and 1.8% in 2027. Productivity per worker is therefore projected to grow by around 0.5% in both 2026 and 2027, close to its historical average.
The unemployment rate is expected to continue the downward trend observed in recent years, although the pace of decline is projected to moderate over the projection horizon, to 0.5 pp in 2026 and 0.3 pp in 2027, to stand at 9.7% in 2027. This decrease reflects expectations that employment growth will slightly outpace growth in the labour force next year (Chart 9).
Chart 10 Unemployment rate developments and projections: year-on-year change and contributions
SOURCES: INE and Banco de España.
In Spain, headline inflation, as measured by the HICP, climbed from 3.5% in April to 5.0% in September according to the flash estimate. This increase relative to April, the latest figure available at the time of the June quarterly report, primarily reflects accelerating energy prices, together with a slight uptick in core inflation (HICP excluding energy and food), while food inflation eased.
Energy prices rose across the board, driving inflation. Energy inflation reached a year-on-year rate of 22% in September, up by 15 pp compared with April. Rising international gas prices, which pushed up wholesale electricity prices, contributed to these developments. This pass-through from higher gas prices to electricity prices was particularly pronounced during the summer months, when renewable energy generation is lower and demand rises owing to high temperatures (Box 3). In turn, the increase in fuel prices since the outbreak of the war in Iran reflects both rising oil prices and higher refining margins, particularly for diesel.
The support measures in place since March have contained the increase in energy prices. In the absence of these measures, average energy inflation between April and August would have been almost 10 pp higher and exceeded the euro area average (Box 4).
Food inflation has eased since March, although it picked up in August and September. The recent upturn in food inflation is associated with higher fresh food prices, whose September year-on-year rate stood at 2.7%. Consumer food prices moved in line with the easing in agricultural prices, domestic producer prices and import prices. Diesel and fertiliser subsidies for the agricultural sector, together with the absence of widespread drought conditions in Spain, also contributed to the moderation in food inflation.
Core inflation stood at 3.5% in September, reflecting strong services prices. Services inflation has exhibited marked persistence, holding at just over 4%, largely associated with the strength of the tourism and hospitality components. The share of services components with inflation rates above 4% rose to an average of 46% between January and August 2026, up from 39% in 2025.
Non-energy industrial goods inflation picked up from April, reaching over 2%, although in September it moderated to 1.6%. The increase in April mainly reflected developments in clothing and footwear prices, although inflation in this component has eased in recent months. A marked acceleration was observed in the prices of technology products such as computers and mobile phones. While these products account for only a very small share of the consumption basket, they contributed around 25% of the increase in non-energy industrial goods inflation between March and August. The increase in technology prices came against the backdrop of sharply rising domestic producer prices and, in particular, import prices for non-energy industrial goods in recent months.
The recent uptick in inflation has been more pronounced in Spain than in the euro area, widening the inflation differential between the two regions from 0.5 pp in April to 1.2 pp in September. This primarily owes to the more pronounced acceleration in energy prices in Spain. However, the main contributor to the inflation differential was services, whose year-on-year inflation rate was 1 pp higher in Spain than in the broader euro area, the widest differential since August 2022. In August (the latest available figure for sub-classes), the bulk of the differential owed to tourism and hospitality services, which account for a larger share of the consumption basket in Spain than in the euro area and whose prices have risen more rapidly in Spain (Box 4).
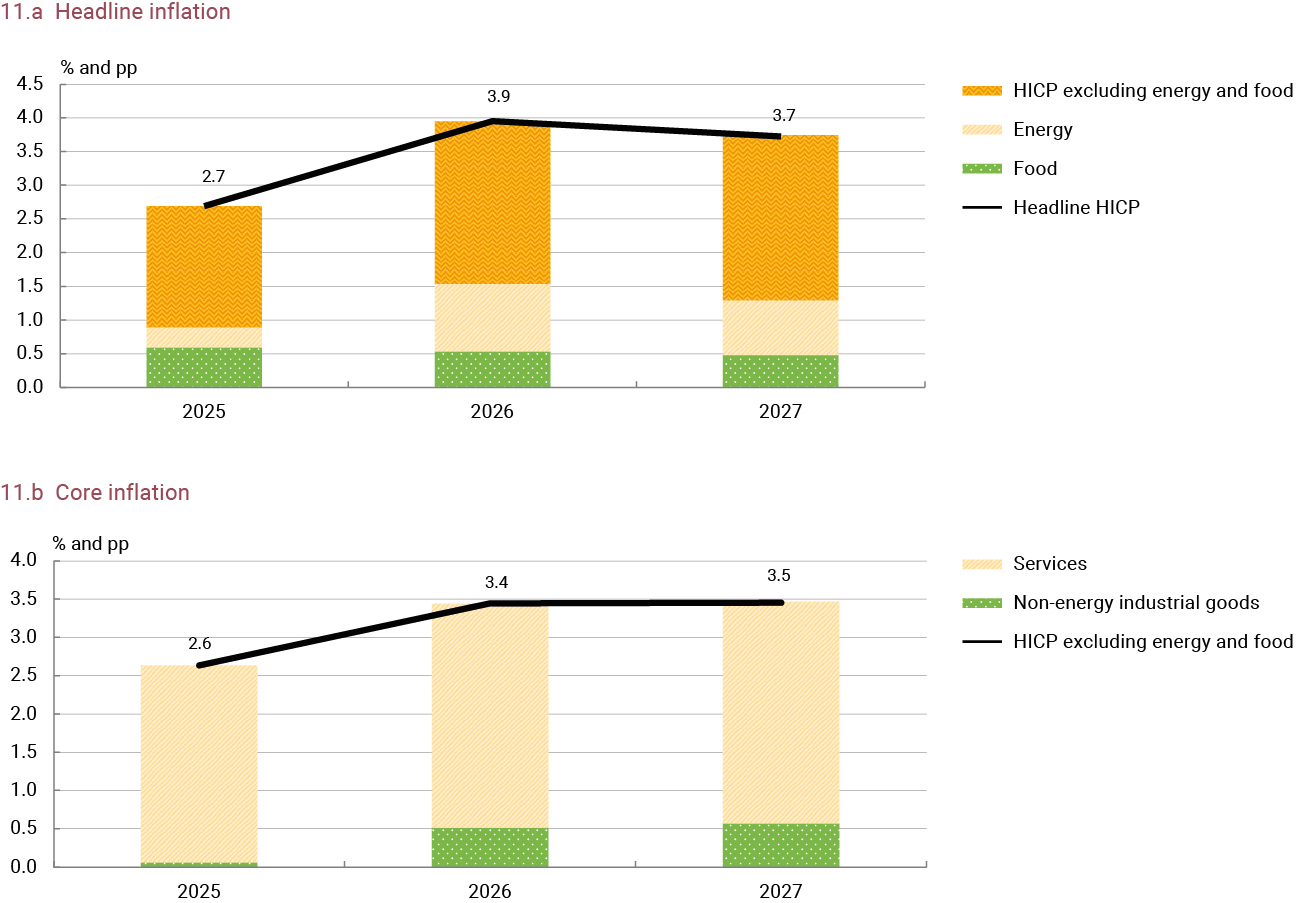
The path of inflation over the coming months will be shaped largely by how the energy shock unfolds. Futures markets project rising oil and gas prices over the coming months. Coupled with the indirect effects of higher energy costs, and factoring in the impact of energy-related fiscal measures, this would bring inflation to around 5.0% towards the end of the year. Accordingly, average annual inflation in 2026 would stand at 3.9%, up by 1.2 pp on 2025. Inflation is expected to rise in early 2027, shaped by the end of energy-related tax deductions and public transport subsidies. Inflation would then embark on a downward path, reflecting the moderation in energy prices and the base effects linked to increases in 2026, with headline inflation easing to an average of 3.7% in 2027 (Chart 11.a).
Core inflation is expected to remain persistently high in the coming months. Average annual core inflation is projected to reach 3.4% in 2026 (0.8 pp higher than in 2025) and 3.5% in 2027 (Chart 11.b). Given the projected strength of domestic demand, coupled with the pass-through of cost increases driven by the energy shock, core inflation is expected to remain relatively stable over the coming months. A temporary uptick in services inflation is expected in early 2027 (when the public transport discounts are withdrawn), but should subsequently fade, in line with the anticipated moderation in private consumption and job creation.
Chart 11 Inflation rate projections and contributions of main components
SOURCES: INE and Banco de España.
Compared with the June projection exercise, inflation forecasts have been revised upwards. The annual inflation rate projected for 2026 has been revised up by 0.3 pp, mainly due to higher expected energy inflation and an upward revision of core inflation (by 0.2 pp). Food inflation, meanwhile, has been revised down, in line with its recent deceleration and the expected path of agricultural prices, domestic producer prices and food import prices. The inflation rate for 2027 has been revised up by 1.1 pp, as energy prices are now expected to ease more slowly. Meanwhile, the core inflation forecast for 2026 has been revised up by 0.2 pp and that for 2027 by 0.3 pp, based on the surprises observed in recent months.
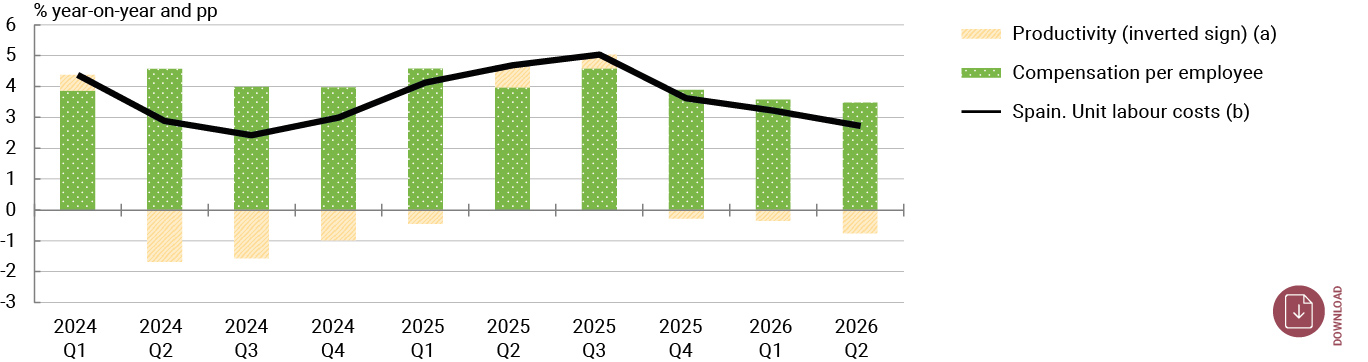
Collective bargaining has kept wage growth contained this year. On data to August, the wage increase negotiated for 2026 stands at 3%, down from 3.5% in 2025. This easing owes to agreements for 2026 signed in previous years, which include an average wage rise of 2.9%, compared with 3.8% for those signed in 2026. All told, growth in compensation per employee in the market economy slowed slightly in 2026 Q2, to 3.5%. Combined with productivity gains of 0.7%, this reduced the pace of growth in unit labour costs to 2.7% (Chart 12).
In turn, slower growth in unit labour costs helped to mitigate inflationary pressures on the production side. In particular, the market economy value added deflator grew by 2.1% in Q2, down by 0.5 pp compared with Q1, as a result of the moderation in labour costs and, to a lesser extent, in gross unit profits and unit taxes.
Chart 12 Unit labour costs in the market economy and contributions of the main components
SOURCES: INE and Banco de España.
Productivity is defined as gross value added divided by the total number of employees.
The change in unit labour costs can be proxied as the sum of the change in compensation per employee and the change in productivity (with an inverted sign). Therefore, a positive contribution of productivity is interpreted as the impact of a decrease in productivity.
Looking ahead to the coming quarters, inflationary dynamics could drive up wage pressures in new collective agreements. In particular, information from a sub-sample of agreements that include future wage increases suggests wage growth of somewhat above 3% over the coming years. Moreover, the recent rise in inflation is expected to exert upward pressure on wage demands in new agreements signed next year. Accordingly, compensation per employee in the market economy is expected to rise by 3.9% in 2026 and 4.2% in 2027, compared with 4.3% in 2025.
Both government revenue and expenditure recorded strong momentum in 2026 H1. In the year to July government revenue grew by a cumulative 8.9% year-on-year, driven by the robust increase in tax revenue (7.7%), social security contributions (7.1%) and capital receipts (95.1%, mainly owing to investment grants associated with NGEU funds). Government expenditure, meanwhile, posted substantial year-on-year growth of 9.2% in the same period, reflecting a broad-based increase in spending items, including government consumption (6.6%), social benefits (6.7%), interest paid (11.7%), current transfers (22.1%, mainly payments to the European Union) and capital expenditure (29.8%, linked to the NGEU programme). Overall, both government revenue and expenditure continued to outpace nominal GDP, which recorded cumulative year-on-year growth of 5.8% in 2026 H1. These government revenue and expenditure developments brought the 12-month cumulative general government balance to 2.5% of GDP in July.
The general government deficit is projected to hold above 2% of GDP over the projection horizon. Overall, the general government deficit is expected to stand at 2.6% of GDP in 2026 and 2.2% in 2027. Vis-à-vis the June projection exercise, the deficit projection for 2026 has been revised up by 0.2 pp, while that for 2027 is revised down by 0.1 pp. The stronger growth in nominal macroeconomic variables – which drive government revenue growth – anticipated in the current projection exercise would help to lower the budget deficit. However, this effect is offset by the cost of the new measures adopted to address the energy shock, a more expansionary government expenditure path than previously envisaged and lower revenue associated with corporate tax changes. Thus, the new deficit estimate for 2026 is 0.5 pp higher than that of the December 2025 projection exercise, in line with the estimated cost of the measures adopted to address the energy crisis (Box 5).
The projected path of government investment remains shaped by the progressive increase in defence spending. This spending component accelerated sharply in July and is expected to end 2026 above its 2025 level. Government investment has also been driven by reconstruction efforts related to the 2024 flash floods, as well as more recent flooding events and other climate effects in different parts of the country. Meanwhile, although the deadline for meeting the milestones and targets linked to payments under the Recovery and Resilience Facility expired on 31 August, the approved projects are expected to continue to affect government expenditure items in the coming quarters. As a result, government investment could stand at just over 3% of GDP in 2026 and 2027.
For the purposes of European fiscal rules, net primary expenditure is expected to grow by over 7% in 2026, well above the 4.8% recorded in 2025. This would mean a cumulative increase of roughly 17% since 2023, 4 pp above the threshold established in the Medium-Term Fiscal-Structural Plan.
Compared with the June projection exercise, debt-to-GDP ratio forecasts have been revised down across the projection horizon. This owes essentially to higher nominal GDP growth, which offsets the deterioration in the general government deficit. Thus, the debt-to-GDP ratio is projected to stand at 98.5% in 2026, before continuing to decline to approximately 96.2% in 2027, again as a result of nominal GDP growth.
Developments in the international environment, linked to the energy crisis stemming from the war in the Middle East, remain the primary external risk factor for the Spanish economy. The collapse of the agreement reached in June to end the conflict has prolonged the closure of the Strait of Hormuz and led to an impasse, further clouding the prospects of a stable and lasting solution in the coming months. Oil prices have remained high as a result, while gas prices have reached their highest levels in recent years. Moreover, the spread of energy supply disruptions to the Strait of Bab el-Mandeb and the G7 initiatives to release diesel reserves underscore the risks surrounding energy supply in the coming months.
According to Banco de España analysis, the events of recent months have raised the likelihood of more adverse geopolitical scenarios than that envisaged in the projections. These scenarios would be marked by a more adverse international environment and higher oil prices than those assumed in the baseline scenario, leading to lower economic growth and higher inflation rates in Spain. Box 6 of this report examines some of the alternative geopolitical scenarios – both more and less adverse than the baseline scenario – and assesses their effects on activity and prices in Spain.
Persistent inflationary pressures have prompted a tightening of monetary policy, the transmission of which could moderate economic growth. The ECB has raised its policy interest rates by 50 bp since the start of the conflict and market expectations have shifted towards higher interest rate paths. Coupled with the recent rise in sovereign yields, this will lead to tighter financing conditions for households and firms. The resulting increase in debt burdens could dampen consumption and investment, with the most indebted agents and those most exposed to variable interest rates being particularly affected. In turn, weakening domestic demand could temper job creation and exacerbate the slowdown in activity.
On the domestic side, housing investment developments represent a key determinant of economic activity in the coming quarters. In recent years, residential construction has not kept pace with rising demand, driven by robust net household formation, which has contributed to the pronounced increase in real house prices. Given the backdrop of these persistent demand-side pressures, residential investment is projected to gradually grow over the projection horizon. However, to date the supply-side response in terms of new housing construction has been weaker than expected, amid labour shortages, rising construction costs and, above all, urban development constraints. The baseline scenario of the projection exercise envisages more dynamic growth in residential investment than in 2025, consistent with the developments observed in building permits and various real estate market indicators. However, to the extent that the private sector and government-subsidised housing programmes accelerate construction in response to demand, residential investment could follow a more robust path than envisaged in the baseline scenario.
On the price side, persistently high headline and core inflation could erode Spain’s competitiveness and economic growth. Inflation rates have risen markedly over the course of 2026 as a result of climbing energy prices, persistently high services inflation and inflationary pressures in certain goods, such as some technology products linked to the development of artificial intelligence. Against this backdrop, the inflation differential vis-à-vis the euro area has widened recently, reaching high levels by historical standards (Box 4). The baseline scenario of these projections indicates that Spanish inflation will remain above the 2% benchmark over the projection horizon. Persistently high inflation, particularly if it continues to exceed that in the euro area, could, in addition to eroding household confidence and purchasing power, result in losses of competitiveness and hamper medium-term economic growth.
The public finances situation constitutes a vulnerability for the Spanish economy. Although nominal GDP growth has helped reduce Spain’s government debt ratio recently, high debt levels and the structural deficit limit the scope for a fiscal policy response to adverse shocks. The absence of concrete measures affecting public finances over the medium term adds uncertainty regarding the future path of government debt. In addition, the worsening fiscal outlook in several advanced economies could drive up their sovereign yields and tighten financing conditions in Spain. This would make it more difficult to reduce Spain’s government debt ratio, owing to both the gradual increase in the interest burden as debt is refinanced and to the potential adverse effects on economic activity.
Introduction
This box presents the results of the 2026 Q3 edition of the Banco de España Business Activity Survey (EBAE). Drawing on a sample of Spanish non-financial corporations, the EBAE assesses every three months how business activity has fared in the current quarter and its outlook for the short term.4 In particular, the survey compiles qualitative information on respondent firms’ turnover, employment, business investment and costs and prices.5 In addition, in this edition firms were asked for the second consecutive quarter how much the effects of the conflict in Iran are impacting their business activity. The fieldwork was conducted between 7 and 21 September. The online survey was sent to a sample of almost 15,000 firms, more than 30% of which regularly respond to Central Balance Sheet Data Office surveys. In line with participation in previous quarters, close to 7,000 valid surveys were received (a response rate of 40%). This box details the main findings drawn from the responses received.
Turnover, employment and investment
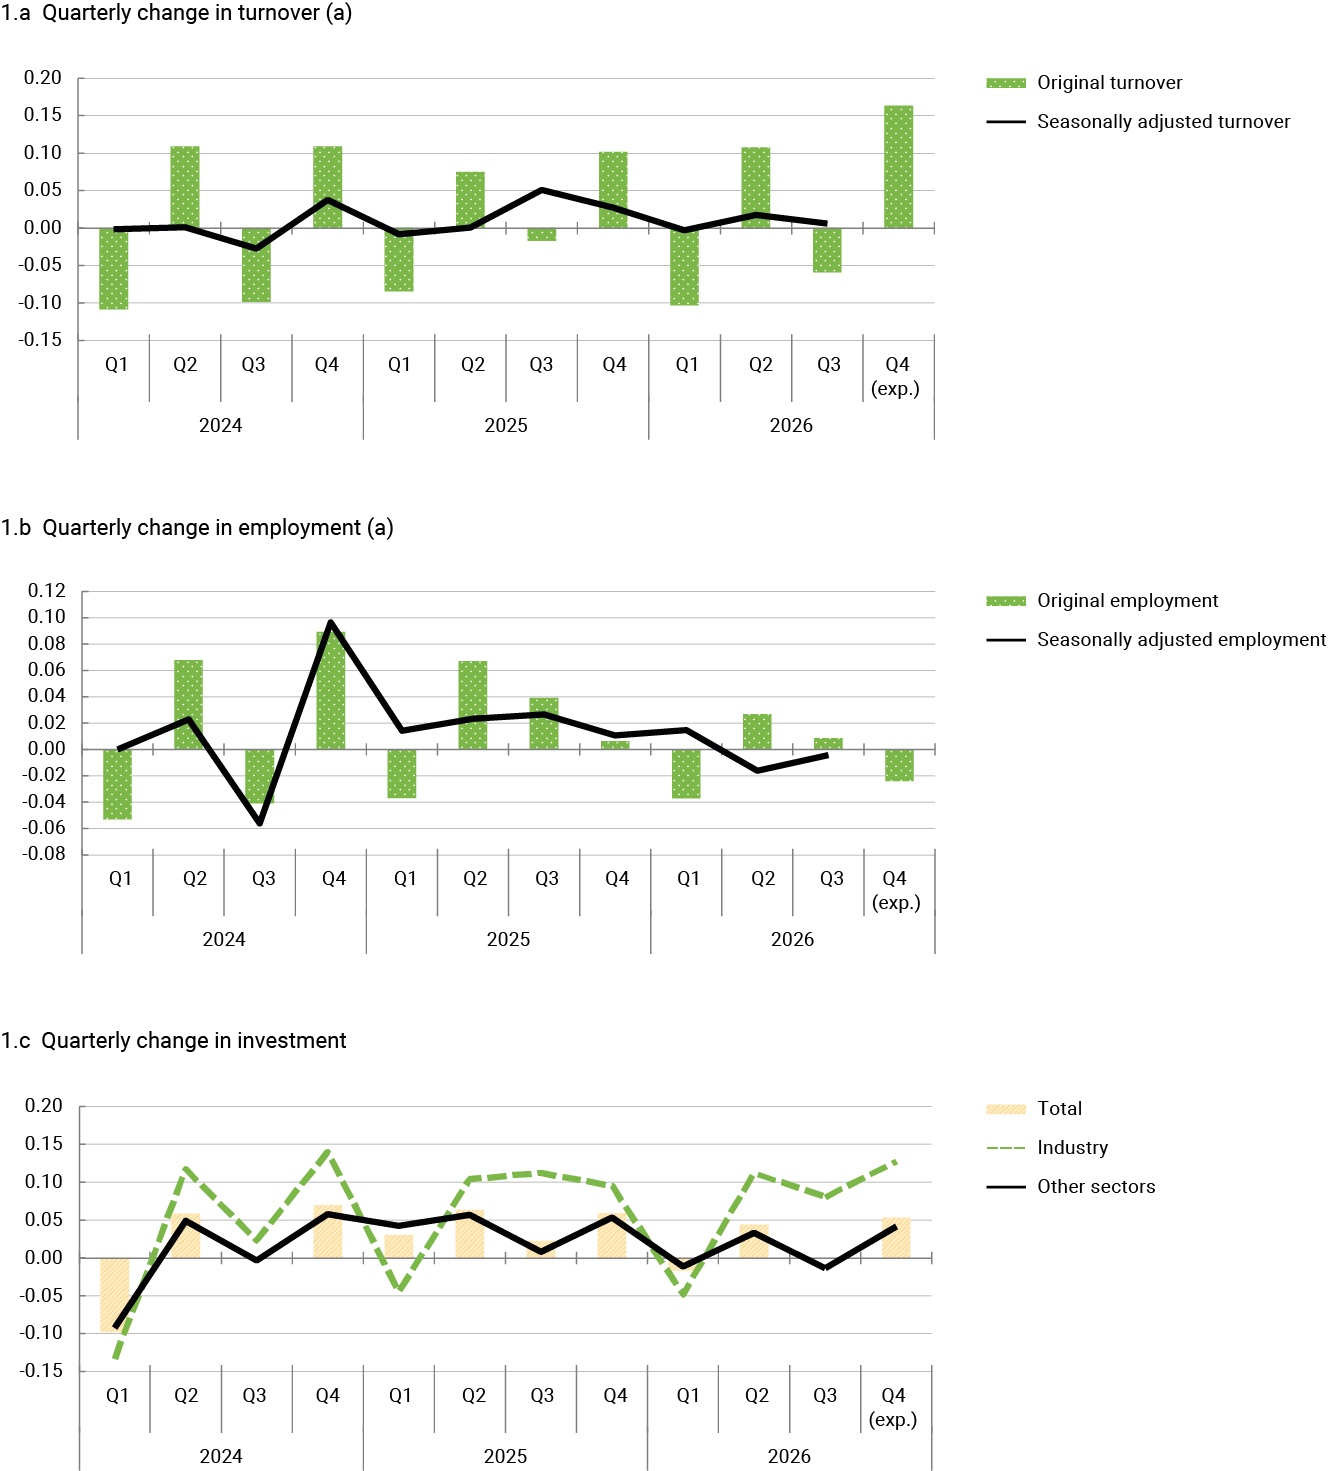
The survey results suggest that turnover declined in 2026 Q3 compared with Q2, consistent with the seasonal pattern typically observed in the third quarter of each year (Chart 1.a). After adjusting for seasonal effects,6 turnover shows a slight increase this quarter. These favourable developments are consistent with the growth signalled by the composite PMI based on data to September. The performance by sector was mixed: turnover increased in certain sectors of services, such as hospitality and information and communication and administrative activities, whereas it declined somewhat more sharply in agriculture, professional, scientific and technical activities and leisure. These relatively encouraging movements in activity are set against a backdrop in which firms perceive that the conflict in Iran is having a less negative impact on demand than in Q2. For instance, the proportion of firms reporting negative or very negative effects of the conflict on international demand fell to 27.8% (compared with 30.3% in Q2) and that reporting negative or very negative effects on domestic demand dropped to 33.7% (down from 36.5% in Q2).
The respondent firms reported a slight increase in employment relative to the previous quarter (Chart 1.b), whereas the seasonally adjusted series shows a decrease,7 albeit somewhat smaller than in Q2. By sector, employment performed more positively in administrative activities, hospitality and information and communication, while it decreased in agriculture, real estate activities and wholesale and retail trade.
The results indicate that investment stabilised in 2026 Q3. However, this aggregate performance reveals an uneven cross-sector performance: investment in industry increased but was more contained in the other sectors. Overall, the moderation of investment is consistent with the stability observed in capacity utilisation since nearly 90% of the firms surveyed reported that their current capacity is sufficient to meet demand, which suggests that there is no across-the-board pressure that prevents capacity utilisation from being increased in the short term.
Meanwhile, the firms’ perception about the impact of the conflict in Iran on investment improved in comparison with the previous quarter. The percentage of firms indicating that their investment decisions were impacted negatively by the heightened uncertainty stood at 40.9%. This was slightly lower than the figure of 43.2% recorded in 2026 Q2. In this setting, business expectations for 2026 Q4 point to the outlook for investment improving somewhat (Chart 1.c).
Overall, the survey results suggest that business activity grew moderately in Q3, reflecting a slight rise in turnover, subdued employment and investment, and that firms perceived a smaller economic impact from the conflict in Iran.
Medium-term outlook for activity
There are no significant changes to turnover expectations for one year ahead with respect to those reported by firms in preceding quarters. Around half of the firms expect turnover to increase, approximately one-third expect no change, and a smaller proportion anticipate a decline. By sector, transportation, administrative activities and non-market services have a more favourable outlook, while expectations are more muted for agriculture and wholesale and retail trade.
Most firms (65%) consider that the likelihood of their turnover expectations materialising is high; in other words, there is a low or normal degree of uncertainty over expected turnover. Moreover, this proportion of firms increased from 57% in Q2.
Costs and prices
The repercussions of the conflict in Iran continue to affect firms’ input costs and selling prices, chiefly through their impact on energy markets. Nevertheless, the survey results suggest that these pressures may have eased slightly in 2026 Q3, compared with the previous quarter.
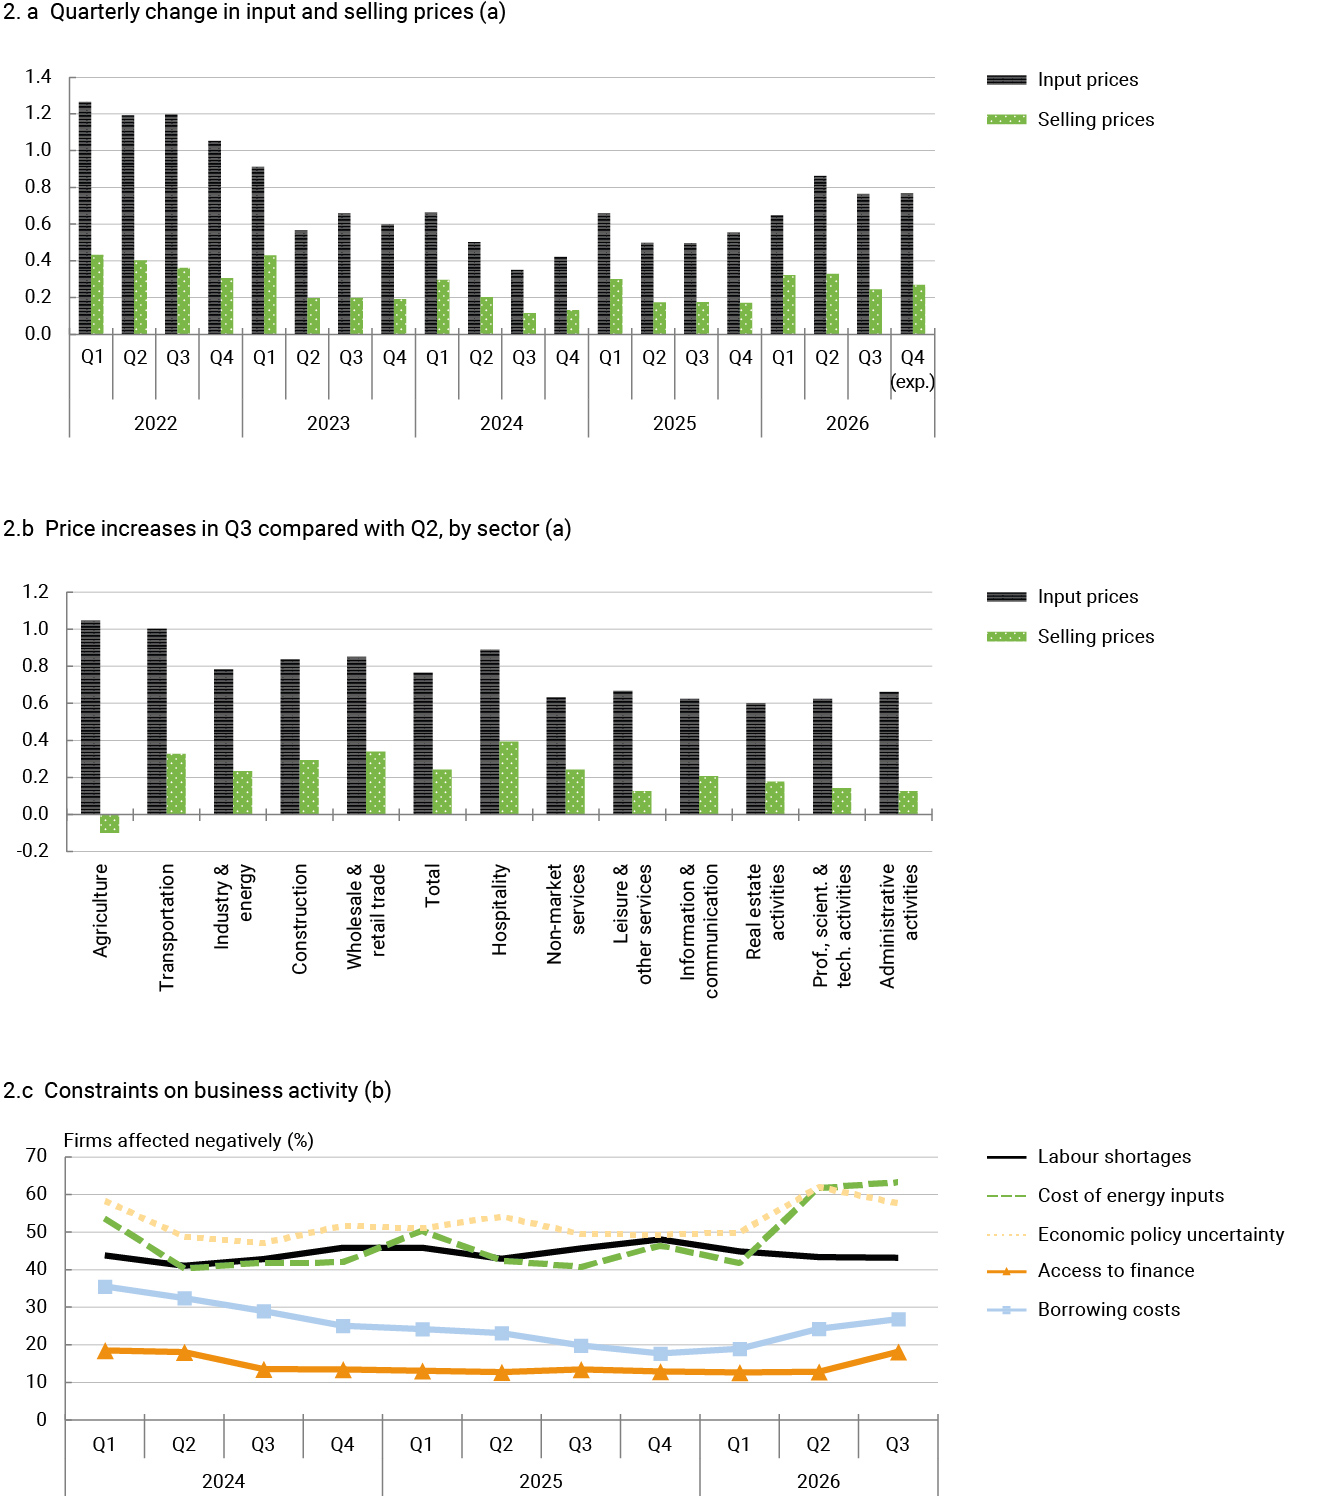
Input costs continued rising at a robust pace, albeit somewhat more moderately than between April and June (Chart 2.a). This moderation appears to be relatively widespread across sectors. Looking ahead, firms continue to expect input costs to rise further over the next 12 months, at broadly the same pace as reported in the previous quarter.
These cost pressures have been partially passed through to selling prices, which also continued to rise in Q3, although again at a somewhat slower pace than in the second quarter. The largest increases were recorded in hospitality, wholesale and retail trade and transportation (Chart 2.b). Meanwhile, expectations for selling prices one year ahead remain virtually unchanged.
For the time being, however, the share of firms reporting higher input costs or selling prices remains below the levels observed in 2022 following the outbreak of the war in Ukraine, when energy prices also surged.
Factors limiting business activity
In Q3, energy input costs continued to be the main factor limiting business activity, with the share of firms reporting this constraint rising slightly to 63.2%, up by 1.4 percentage points (pp) on the previous quarter (Chart 2.c). Nonetheless, this share remains below the level recorded following the outbreak of the conflict in Ukraine, when it stood at close to 80%. Economic policy uncertainty also continued to be a significant constraint, although its impact declined by 4.4 pp to 57.6%. Meanwhile, the proportion of firms constrained by labour shortages remained largely unchanged at 43.1%.
Chart 1 Turnover, employment and business investment: change and outlook
SOURCE: EBAE.
Index constructed by assigning the following values to firms' qualitative responses: significant increase = 2, slight increase = 1, unchanged = 0, slight decrease = -1, significant decrease = -2.
Chart 2 Prices and constraints on economic activity
SOURCE: EBAE.
Index constructed by assigning the following values to firms' qualitative responses: significant increase = 2, slight increase = 1, unchanged = 0, slight decrease = -1, significant decrease = -2.
Firms reporting a negative or very negative impact of each of these factors on their activity.
Other constraints notably include financing difficulties, which increased, although their prevalence was still moderate. The percentage of firms citing access to finance as a constraint increased by 5.4 pp to 18.2%, with cross-sector differences and a slightly stronger increase among larger firms. Meanwhile, the share of firms affected by borrowing costs increased by 2.5 pp to 26.8%, with SMEs reporting a somewhat greater impact on their business activity.
Lastly, following the slight increase observed in the previous quarter, supplier delivery problems became a less significant factor limiting business activity, as the share of firms identifying it as a constraint fell by 2 pp to 13.6%. This development is consistent with firms’ perception, to date, of the conflict in Iran having a smaller impact on the supply of energy and non-energy inputs.
This box describes the technical assumptions underlying the 2026 Q3 projection exercise. Compared with the June projection exercise, the upward revision to the Spanish economy’s export markets is notable. This is the result of the resilience of the European and global economies to the energy shock in the months following the outbreak of the war in the Middle East. The more positive outlook for the external markets is offset by the less favourable path for energy commodity prices than expected in the Q2 projection exercise. Financial conditions are also tighter in these projections than previously projected (Table 1).
Table 1 International environment and monetary and financial conditions (a)
| Annual rate of change (%), unless otherwise indicated | |||||
|---|---|---|---|---|---|
| 2026 Q3 projections |
Difference between the current projections and the June 2026 projections (b) |
||||
| 2025 | 2026 | 2027 | 2026 | 2027 | |
| International environment | |||||
| Spain's export markets (growth rate) (c) | 3,9 | 2,9 | 3,3 | 0,8 | 0,6 |
| Oil price in dollars/barrel (level) | 69,2 | 96,3 | 85,4 | -0,6 | 3,2 |
| Wholesale electricity price in €/MWh (level) | 65,5 | 91,1 | 79,1 | 25,3 | 21,7 |
| Monetary and financial conditions | |||||
| Dollar/euro exchange rate (level) | 1,13 | 1,2 | 1,1 | 0,0 | 0,0 |
| Nominal effective exchange rate against non-euro area countries (d) (2000 = 100) |
119,6 | 122,6 | 121,9 | -0,8 | -1,4 |
| Short-term interest rate (3-month EURIBOR; level) (e) | 2,2 | 2,5 | 3,6 | 0,1 | 0,8 |
| Long-term interest rate (10-year Spanish government bond yield; level) (e) |
3,2 | 3,6 | 4,2 | 0,1 | 0,5 |
SOURCES: ECB and Banco de España.
Cut-off date for assumptions: 24 September, except those relating to the export markets, whose cut-off date is 19 August. Figures expressed as levels are annual averages, figures expressed as rates are calculated on the basis of the related annual averages.
Differences calculated based on figures rounded to one decimal place, except in the case of the exchange rate, which is rounded to two decimal places.
The assumptions regarding the behaviour of Spain’s export markets are obtained from the European Central Bank staff macroeconomic projections.
A positive percentage change in the nominal effective exchange rate denotes an appreciation of the euro.
For the projection horizon, the figures in the table are technical assumptions, prepared following the Eurosystem’s methodology. These assumptions are based on futures market prices or on proxies thereof and should not be interpreted as a Eurosystem prediction as to the path of these variables.
Spanish export market growth for 2026 is revised up by 0.8 percentage points (pp), to 2.9%. This upward revision also applies to 2027, with export market growth accelerating to 3.3%, 0.6 pp higher than projected in June.
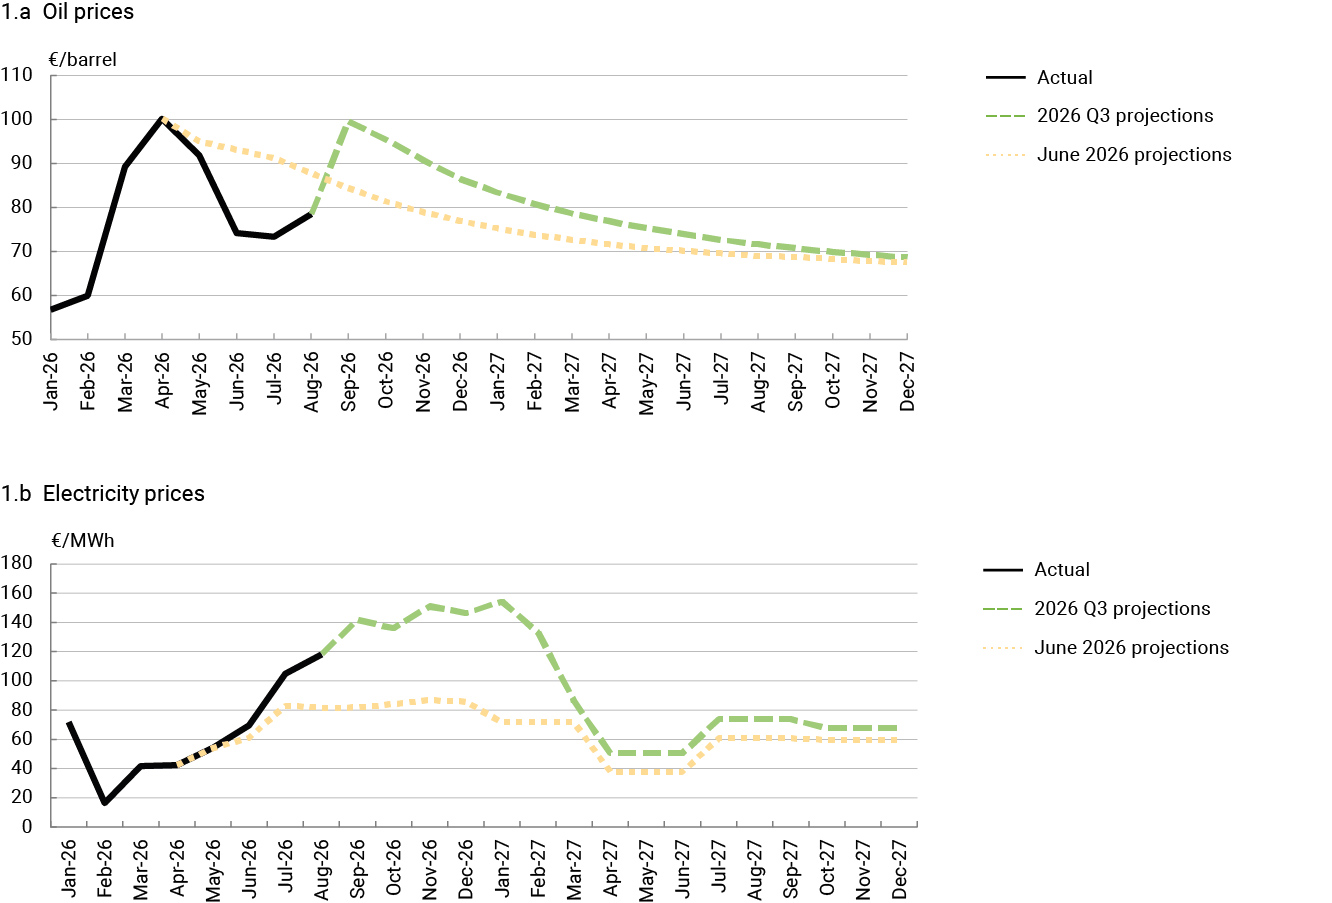
Meanwhile, despite the recent increase, oil prices have risen less in recent months than projected in June (Chart 1). Looking ahead, the markets are expecting this increase to continue up to the beginning of autumn, far exceeding the June projections. Oil prices will then gradually ease, to converge to levels similar to those projected in June by the end of the projection horizon.
Chart 1 Energy price assumptions
SOURCES: Reuters, OMIE and Banco de España.
Meanwhile, wholesale electricity prices have stood well above those projected in June, as a result of their sharp rise over the summer, linked to the increase in gas prices (Box 3). While the markets anticipate an adjustment in these prices from 2027, they are expected to remain at levels well above those projected in June.
In addition, financial markets are pricing in tighter financial conditions amid persistently high inflation rates, a considerable increase in long-term sovereign yields and expectations of future monetary policy tightening. In particular, the expected paths of short and long-term interest rates are higher than projected in June for both 2026 and 2027, entailing tighter financial conditions for households and firms.
Turning to the exchange rate, the euro is slightly weaker than in the June projection exercise, both with respect to the US dollar and in nominal effective terms.
As regards the fiscal assumptions, compared with the June projections, the measures incorporated into this projection exercise include the two extensions to September and December of the tax measures in response to the Iran crisis (Royal Decree-Law 18/2026 and Royal Decree-Law 25/2026), the dependency system reform that increases the amounts the central government transfers to the regional governments (Royal Decree-Law 17/2026), the urgent measures in response to the crisis in Ceuta and the wildfires across Spain (Royal Decree-Law 22/2026 and Royal Decree-Law 20/2026) and the projected effects of the regularisation of immigrants launched in May 2026, whose fiscal impact is subject to a high degree of uncertainty and is expected to materialise fully in 2027. Overall, these measures are estimated to drive up the general government deficit by around 0.3 pp of GDP in 2026 and 0.2 pp in 2027.
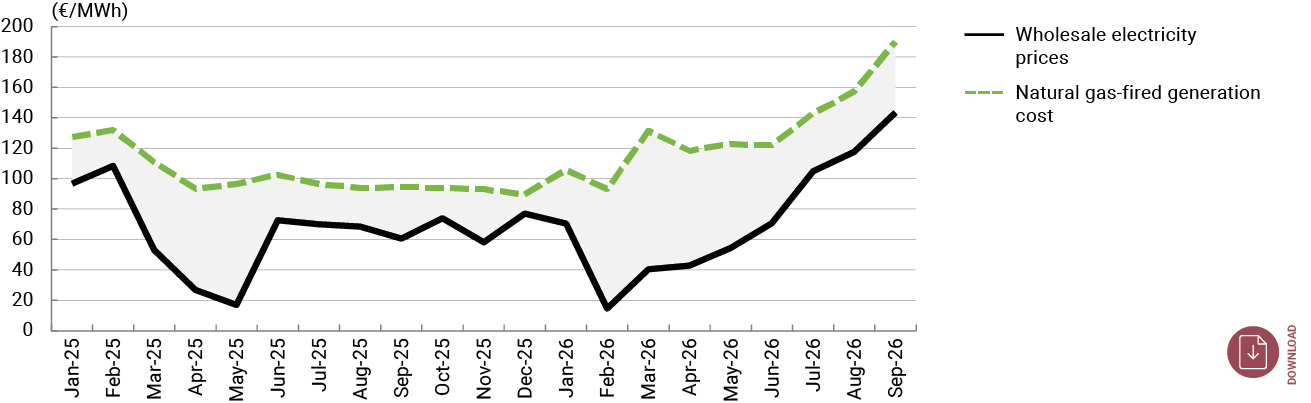
The price of natural gas has risen sharply on European markets in 2026 owing to the conflict in the Middle East. The blockade of the Strait of Hormuz at end-February disrupted nearly a fifth of the global trade in liquefied natural gas, including exports from Qatar. On the Iberian gas market (MIBGAS), gas prices spiked when the conflict broke out, from €30 per megawatt-hour (€/MWh) in late February to above €50/MWh in early March. After easing following the temporary ceasefire in April, they rose again in the wake of the conflict’s resurgence over summer, reaching €78/MWh in September, more than double their February levels. Similarly, wholesale electricity prices in Spain have risen, although the pass-through of higher gas prices has varied over the course of the year (Chart 1). In spring, the impact was mitigated owing to significant renewable energy generation typically seen at that time of year and wholesale electricity prices remained moderate, with monthly averages ranging from €40/MWh to €55/MWh. In summer, by contrast, the pass-through was much more intense, and in September the price reached €143/MWh, its highest monthly level since February 2023.
Chart 1 Wholesale electricity prices in Spain and natural gas-fired generation cost (a)
Sources: ENTSO-E (daily market prices), MIBGAS (gas in Spain) and EEX (EU Emissions Trading System emission allowances auctions).
Monthly averages. Natural gas-fired generation cost = 2 × gas price (€/MWh) + 0.4 × emission allowance price (€/t), corresponding to the variable cost of an efficient combined-cycle plant.
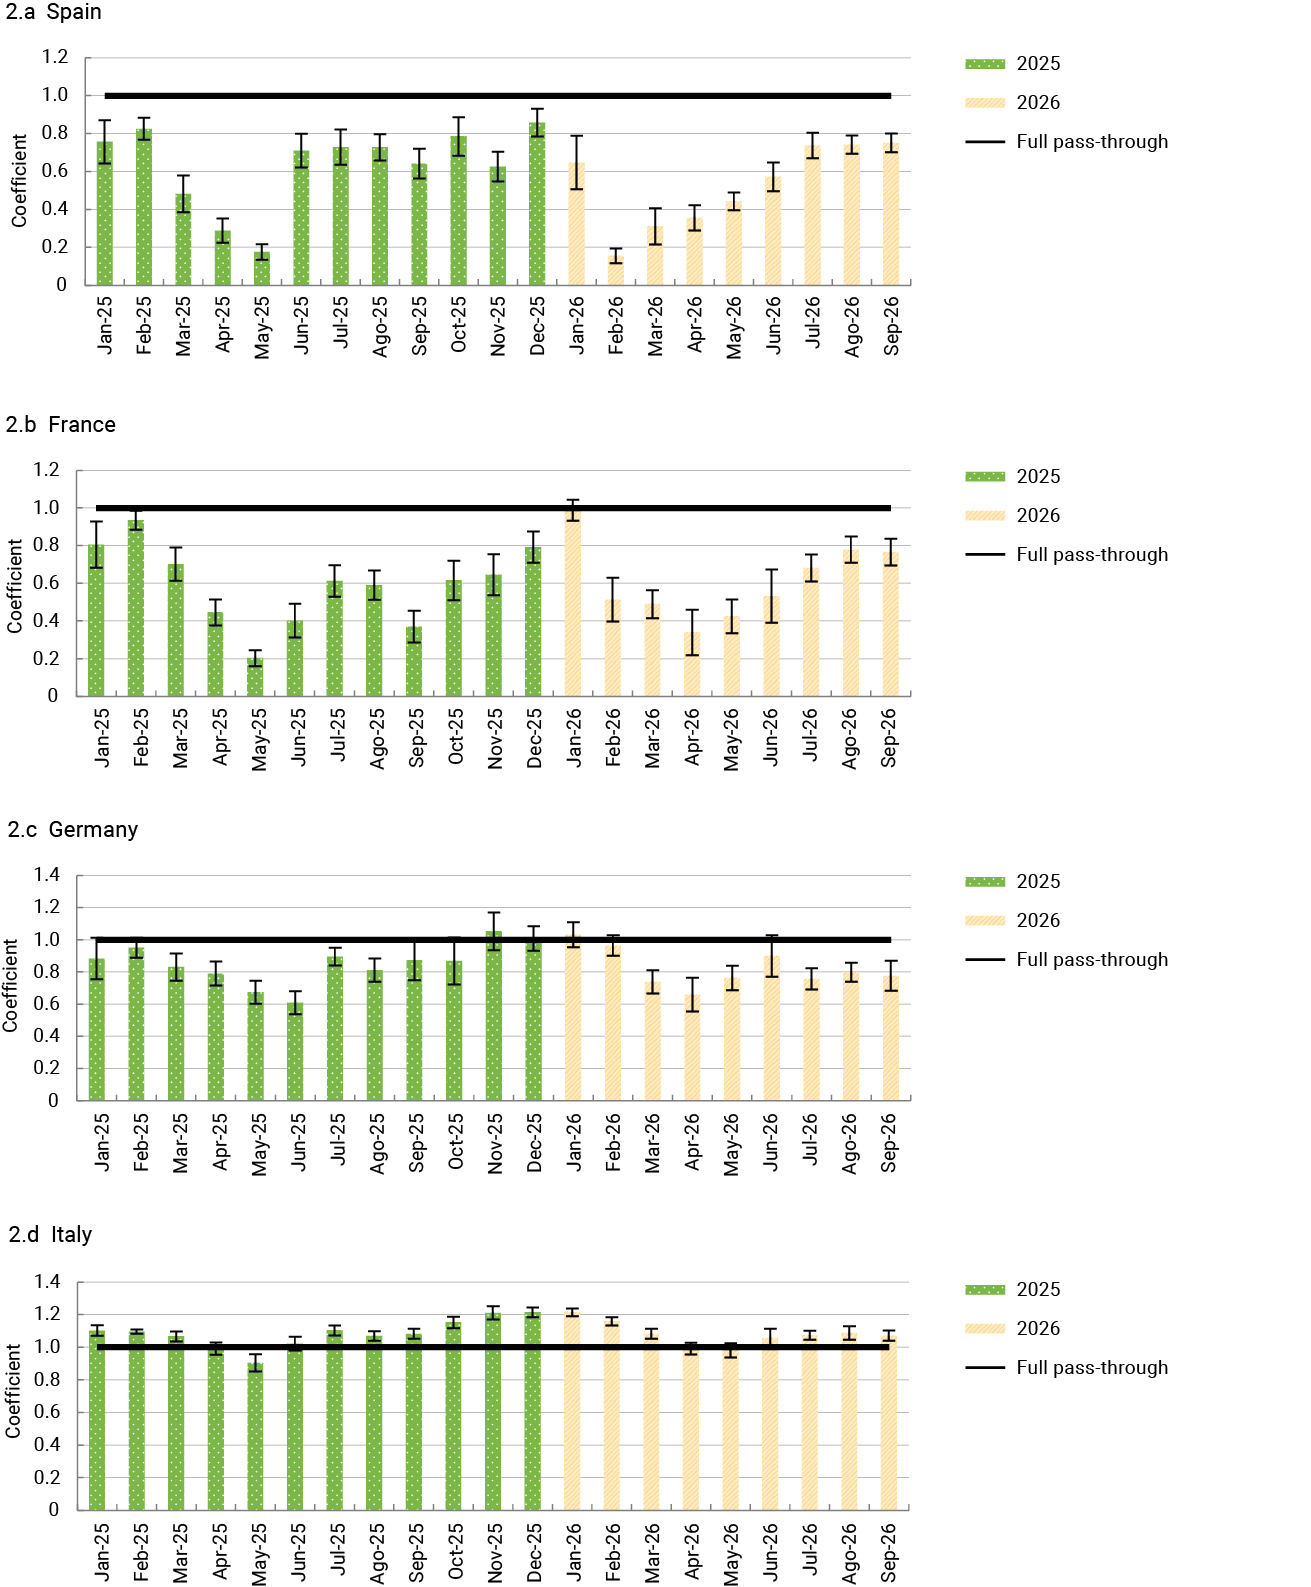
This asymmetry in price movements reflects the design of the wholesale electricity market, in which the hourly price is determined by the last generating technology needed to come online to satisfy demand. When demand can be met entirely from wind, solar, hydraulic and nuclear sources (technologies with very low variable costs), the electricity price is low and barely determined by gas. When combined cycle plants are needed, the price tends to be set by their variable cost.8 To measure the extent to which this natural gas-fired generation cost is passed through to electricity prices, a monthly regression is calculated of the hourly electricity price on that cost. The coefficient of this regression, or pass-through coefficient, would equal 1 if the average electricity price fully mirrored the cost of generating electricity using natural gas, and would be 0 if it was entirely unaffected.
In Spain, the pass-through coefficient exhibits marked seasonality in both 2025 and 2026 (Chart 2.a). In spring, gas sets the electricity price during very few hours of the day, and the coefficient remains below 0.5. In summer, by contrast, combined-cycle plants are needed during a large share of the hours when solar generation is unavailable, namely at night and in the late afternoon, and the coefficient rises to near to 0.75. As a result, the impact of higher gas prices on electricity prices depends on the time of year at which the increase occurs. The rise in gas prices in March was barely passed through to electricity prices, which were in fact lower than a year earlier, amid weaker demand and higher solar photovoltaic generation than in 2025. By contrast, in July and August around three-quarters of the increase in gas-fired generation costs was passed through to electricity prices. For example, in August that cost was €63/MWh higher than a year earlier, while the electricity price increased by €49/MWh.
Electricity prices in Germany and Italy are more sensitive to gas prices than in Spain, although this sensitivity varies less throughout the year. France, where nuclear power accounts for a larger share of electricity generation, displays a pattern more similar to that observed in Spain (Charts 2.b, 2.c and 2.d). In Italy, the gas price sets the electricity price during most hours of the day and the coefficient stands at around, or even slightly above, 1, meaning that the increase in gas prices has been passed through almost entirely to electricity prices since March. In Germany, gas sets the electricity price during a significant share of hours in both spring and summer, and the coefficient remains high throughout the year: this year it stood at around 0.7 in spring and 0.8 in summer. In France, pass-through increased during the summer as nuclear generation was lower than a year earlier, and electricity prices almost doubled in July and August compared with 2025. As a result, in August and September wholesale electricity prices in Spain were at levels similar to those observed in France and Germany, having been roughly half those in Germany during the spring.
Overall, the share of renewables in Spain means that wholesale electricity prices are largely unaffected by gas price developments in the spring. However, this is not the case in the summer or, generally speaking, the autumn or winter. In these seasons, gas-fired combined-cycle power plants are still needed to meet demand in a considerable number of hours. According to the coefficients estimated, a €10/MWh increase in gas prices raises wholesale electricity prices by some €15/MWh in the summer – twice the spring increase. If gas prices remain at their high levels over the coming months, they can be expected to continue being largely passed through to electricity prices. This was the case, albeit with lower gas prices, between September 2025 and January 2026, when the coefficient ranged from 0.6 to 0.9. The September data point in this direction: with the tensions in the Strait of Hormuz unresolved, both gas and electricity prices stood above their current levels. At the cut-off date for the assumptions used in this report, futures markets were signalling that electricity (€141.4/MWh) and gas (€74.2/MWh) prices would remain high in 2026 Q4.
Chart 2 Pass-through of the gas-fired generation cost to wholesale electricity prices (a)
SOURCES: ENTSO-E (daily market prices), national gas hubs (Spain: MIBGAS-PVB; France: PEG; Germany: THE; Italy: PSV) and EEX (EU Emissions Trading System emission allowances auctions).
Coefficient of a regression through the origin of the hourly electricity price on the natural gas-fired generation cost, estimated for each month. A value of 1 denotes that the price replicates that cost. The whiskers represent the 95% confidence band. Natural gas-fired generation cost = 2 × gas price (€/MWh) + 0.4 × emission allowance price (€/t), corresponding to the variable cost of an efficient combined-cycle plant.
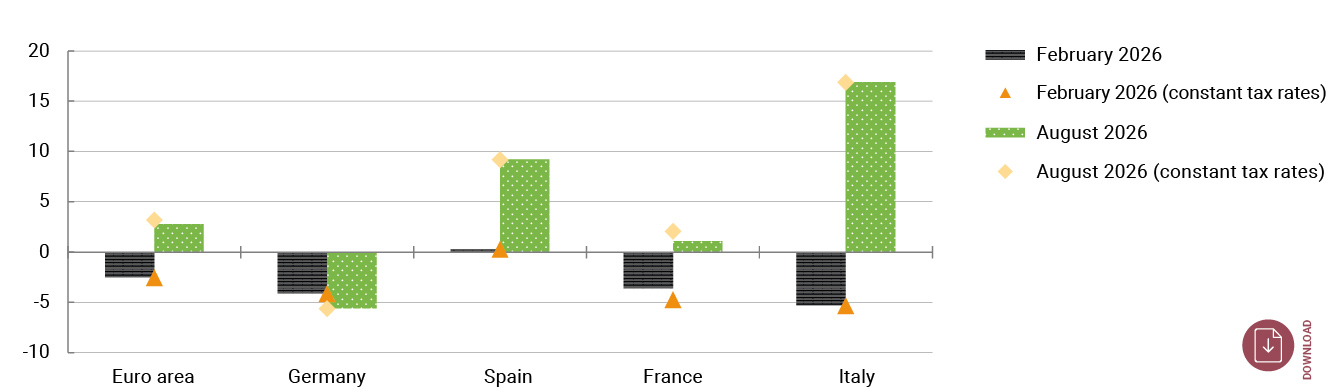
To assess the impact of these developments on inflation, the differences in the pass-through of changes in electricity prices on wholesale markets to retail markets must be considered. Compared with its European peers, Spain is characterised by the high frequency with which consumer prices are revised, resulting in greater and faster pass-through of changes in wholesale market prices to those paid by the end consumer.9 In particular, in 2025 around 27.5%10 of Spanish households opted for a regulated rate for small consumers, while such regulated dynamic pricing systems are generally not typical in other European countries.11 Despite the reform adopted in 2024 to make the system for setting the regulated rate for small consumers less dependent on daily prices,12 electricity inflation in Spain remains more volatile than the euro area average. In the recent period, electricity pricing in Spain has passed through higher gas prices to the end consumer more quickly. This contributes to Spain’s sizeable positive inflation differential in the electricity component compared with the euro area, on the latest data available (August 2026) (Chart 3). By country, the increase in this component in Spain is greater than in France – with a similar degree of pass-through of higher gas prices to wholesale electricity prices – and Germany (despite the greater impact of higher gas prices on the wholesale electricity market there). Among the major euro area countries, electricity inflation in Spain is only lower than in Italy,13 where wholesale prices have increased more. Against this background, Spain’s positive electricity inflation differential relative to the euro area as a whole explained 2.4 percentage points (pp) of the inflation differential in the overall energy component (2.8 pp) in August.
Chart 3 Electricity inflation rate
Source: Eurostat.
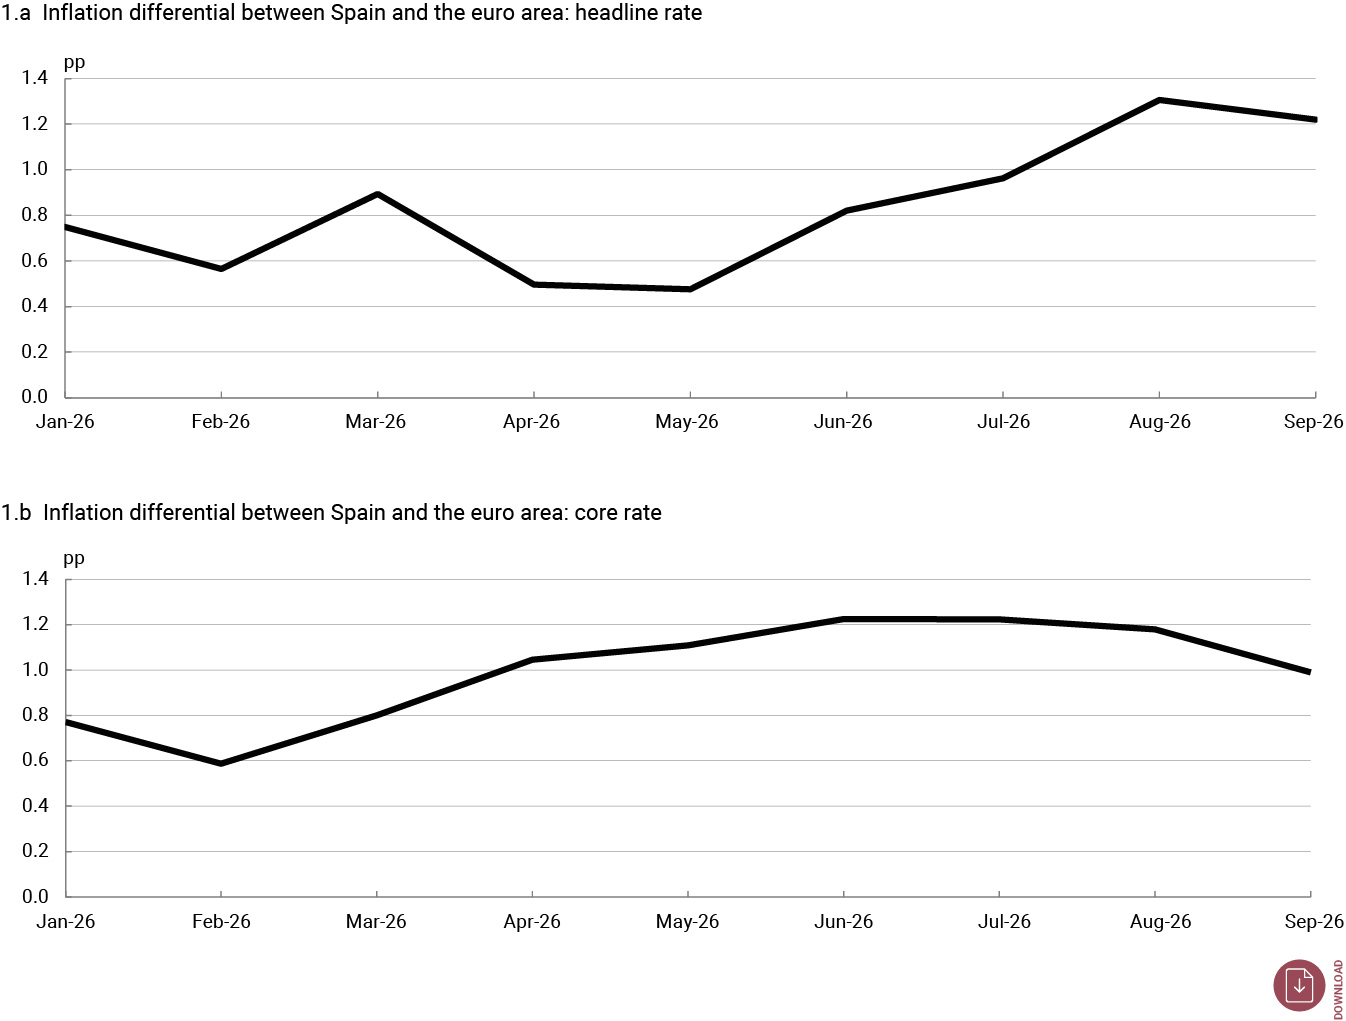
Since mid-2025 consumer prices have increased at a persistently faster pace in Spain than in the broader euro area. Indeed, between July 2025 and September 2026 the inflation differential, that is, the difference between inflation rates in Spain and the euro area, averaged 0.9 percentage points (pp) for headline inflation and 0.8 pp for core inflation. Moreover, these differentials have widened markedly since the outbreak of the conflict in the Middle East, from 0.6 pp for both indicators in February to 1.2 pp for headline inflation and to 1 pp for core inflation in September (Chart 1).14 From a long-term perspective, headline and core inflation differentials are at their highest levels since August 2022 and September 2006, respectively (Chart 2).
Chart 1 Inflation differential between Spain and the euro area in 2026
Source: Banco de España.
Chart 2 Inflation differential between Spain and the euro area since 2000
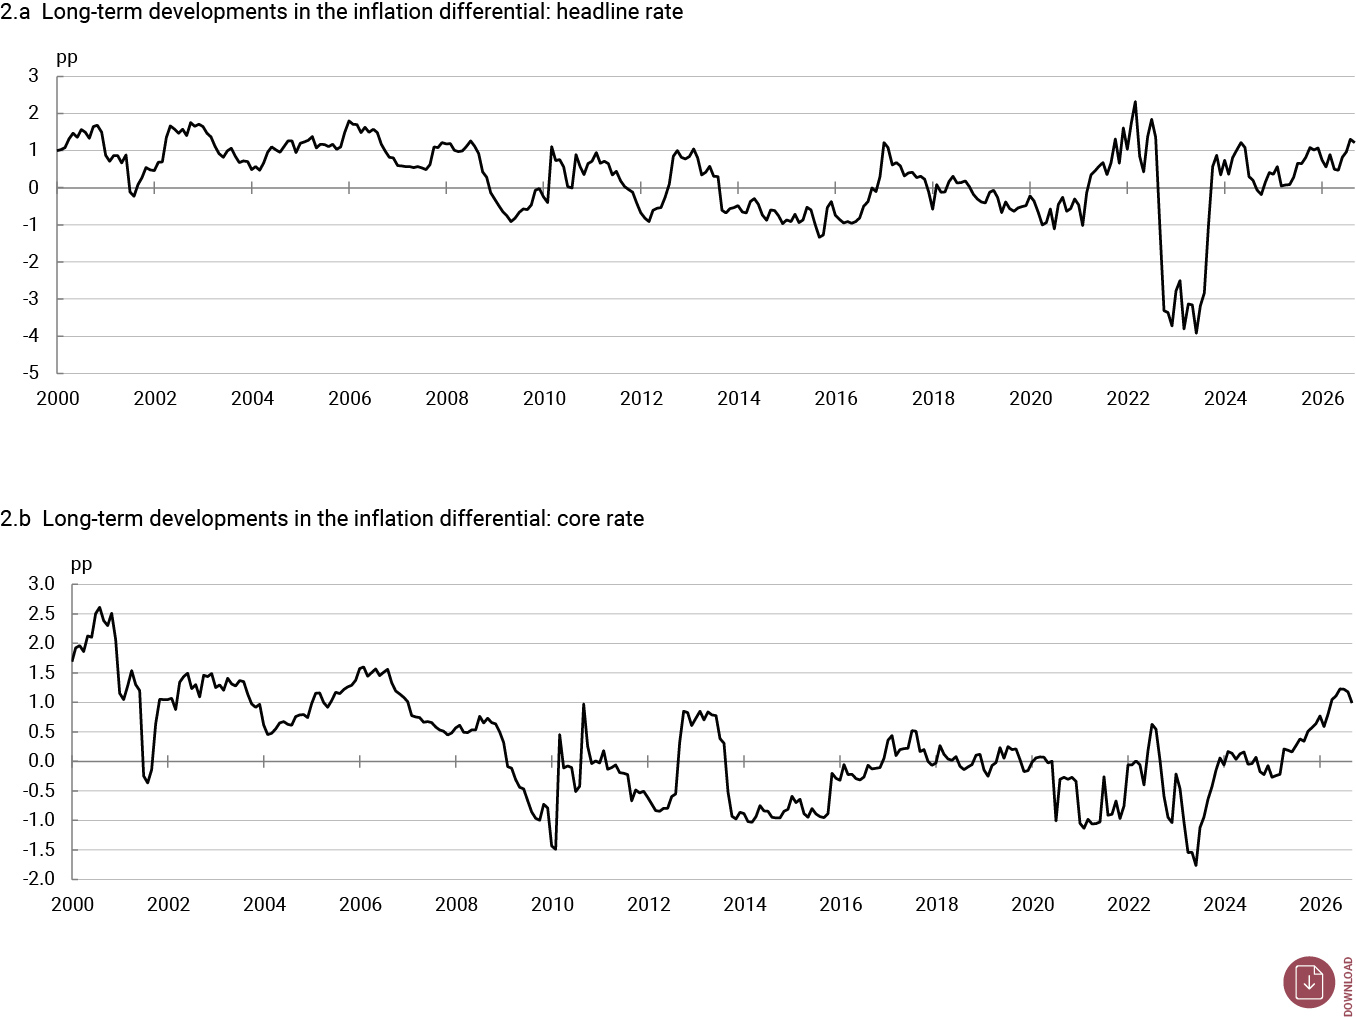
SOURCE: Banco de España.
Against this background, this box documents the main components behind the widening of the inflation differential between Spain and the euro area in recent months. Persistently positive inflation differentials, particularly when they spread to services and other core inflation components, warrant close monitoring, as they could gradually erode the Spanish economy's competitiveness vis-à-vis its main trading partners. In a monetary union, any loss of competitiveness can only be corrected through a subsequently larger easing in domestic prices and costs.
Table 1 presents the contributions of various groups of products (food, energy goods, non-energy goods and services) to the inflation differential between Spain and the euro area in three representative months of 2026: February, prior to the energy crisis triggered by the attack on Iran; May, when tax relief measures had their strongest impact on energy prices in Spain;15 and September, the most recent month with data available.
Table 1 Contributions to the inflation differential between Spain and the euro area in 2026
| pp | |||||
|---|---|---|---|---|---|
| Share of the consumption basket (%) | |||||
| February | May | September | Spain | Euro area | |
| Headline inflation | 0.56 | 0.48 | 1.22 | ||
| Contributions | |||||
| Food | 0.26 | 0.15 | 0.31 | 20.2 | 19.0 |
| Unprocessed food | 0.17 | 0.01 | 0.15 | 6.5 | 5.2 |
| Processed food | 0.08 | 0.15 | 0.16 | 13.7 | 13.8 |
| Energy | -0.02 | -0.42 | 0.24 | 8.8 | 9.0 |
| Non-energy industrial goods | 0.01 | 0.18 | 0.04 | 19.6 | 25.3 |
| Services | 0.31 | 0.56 | 0.64 | 51.4 | 46.7 |
| Core inflation | 0.59 | 1.11 | 0.99 | ||
| Contributions | |||||
| Non-energy industrial goods | 0.06 | 0.27 | 0.06 | 27.6 | 35.1 |
| Services | 0.54 | 0.85 | 0.92 | 72.4 | 64.9 |
SOURCE: Banco de España.
Services were the main contributor to the inflation differential, with their contribution increasing from 0.3 pp in February to 0.6 pp in September, when they accounted for approximately half of the total differential. Overall, the services component has made the most sustained contribution to the inflation differential between Spain and the euro area, in keeping with the downward stickiness of services inflation in recent years.
Meanwhile, the contribution of the energy component has varied significantly over recent months. Prior to the outbreak of the war in the Middle East, energy inflation rates in Spain and the euro area were similar, meaning their contribution to the inflation differential in February was virtually zero. This contribution then turned negative in May as a result of the larger tax relief measures introduced in Spain to mitigate the impact of the conflict, which tempered the increase in energy prices. As these measures were unwound the contribution of the energy component increased and moved into positive territory in August and September (Table 1 and Chart 3).
Chart 3 Energy inflation
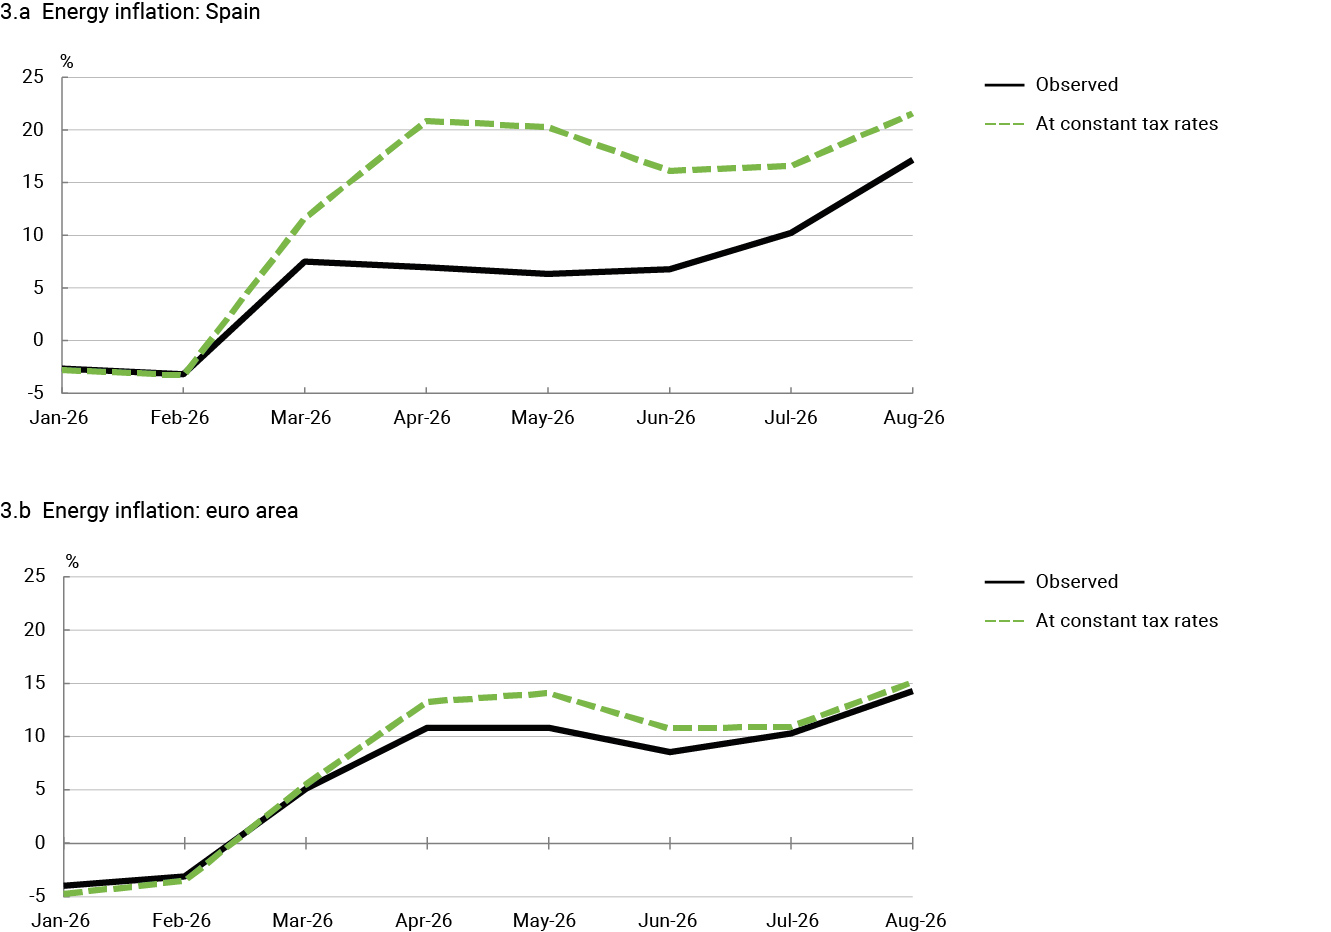
SOURCE: Banco de España.
The remaining product groups, namely food and non-energy industrial goods, have likewise contributed positively to the inflation differential in recent months. The contribution made by food rose markedly between May and September, driven by the acceleration in unprocessed food prices, while processed food inflation has been consistently higher in Spain than in the euro area. In the case of non-energy industrial goods, the differential narrowed in September, reducing its contribution to less than 0.1 pp. Most of the differential for this group is accounted for by developments in the highly volatile clothing and footwear component.
The war in the Middle East has affected fossil fuel prices and the energy system, driving up energy costs significantly. These developments bear similarities to the tensions observed in energy markets following Russia’s invasion of Ukraine, which triggered an inflationary process in 2022-23. The pass-through of higher energy prices to headline inflation has important implications for macroeconomic stability, the well-being of households and the outlook for firms. These effects are particularly strong for vulnerable households and for the sectors most exposed to rising energy costs.
The experience from 2022-23 provides a useful framework for an initial analysis of the current fiscal response. Assessments of that episode show that the fiscal measures adopted considerably mitigated the loss of household purchasing power, although their distributional effects varied across countries and across households within each country.16 These papers show that the distributional impact of the fiscal response depends on how the measures are designed and how they interact with households’ consumption patterns. In light of these analyses, this box first describes the fiscal measures adopted in Spain in response to the current energy shock, their budgetary cost and their effect on inflation. It then looks at the distributional impact on households of some of these measures (cuts in taxes on fuel, gas and electricity).
These measures can be assessed based on the general recommendation of the European Commission, the European Central Bank (ECB) and the Organisation for Economic Co-operation and Development (OECD) that support measures should be targeted, temporary and appropriately calibrated. This requires balancing their objectives, namely protecting vulnerable or particularly affected groups and limiting price increases, against their drawbacks, including their budgetary cost and the distortion of price signals, which weakens incentives to reduce consumption of the goods that have become more expensive.
The fiscal response to the energy shock in the international context
Spain’s fiscal response to the current episode is part of a broader pattern of responses among advanced economies. According to the OECD, as at 9 April 2026, 26 out of its 38 member countries had implemented an initial response comprising at least one support measure to address the energy shock stemming from the conflict in the Middle East. The most common interventions were reductions in motor fuel taxes, as well as cuts to VAT and excise duties.17
Within Europe, the response appears to have relied, as in the 2022-23 episode, largely on measures that were not targeted at specific groups, mainly broad-based reductions in energy-related taxes. The European Commission estimated in May 2026 that around three-quarters of the budgetary cost incurred in the European Union as a whole had been implemented through untargeted measures.18 On data up to end-May 2026, the ECB estimated that untargeted measures accounted for around 60% of the gross fiscal cost incurred, with two-thirds of the support directed at households and one-third at firms.19 Based on these data, the aggregate size of the initial fiscal response adopted in the euro area between the onset of the conflict and May is estimated at around 0.1% of GDP.
Compared with other countries, Spain stands out for the scale of its initial fiscal response. Estimates by the European Commission and the OECD put the fiscal package implemented by May at 0.25% and 0.3% of GDP, respectively.20 Subsequently, both Spain and other European economies approved extensions or introduced new packages comprising both tax reductions and support for affected industrial sectors. On the information available to end-September, Spain had allocated a cumulative 0.52% of GDP to the measures adopted, according to Banco de España estimates. The total amount is equivalent to around one-fifth of the general government deficit projected by the Banco de España for 2026, which would reach 2.6% of GDP.
The fiscal measures adopted in Spain
Spain’s fiscal response to the energy shock was structured around three packages of measures: Royal Decree-Law 7/2026 of 20 March 2026, Royal Decree-Law 18/2026 of 29 June 2026 and Royal Decree-Law 25/2026 of 29 September 2026, all adopted under the Comprehensive Response Plan to the Crisis in the Middle East. Table 1 shows the measures adopted, their duration and their budgetary impact. A first set of measures consisted of broad-based reductions in taxes on energy – including VAT on motor fuels, electricity, gas and firewood and excise duties on hydrocarbons and electricity – and in the tax base for the electricity generation tax. A second set of measures comprised subsidies and direct grants for the sectors most intensive in energy use: tax reductions for fuel for professional and agricultural uses and support for energy-intensive industries, the primary sector and the transport sector.
These packages bear strong similarities to the measures adopted during the inflationary crisis of 2022-23. They consist primarily of broad-based interventions aimed at containing price increases, together with subsidies for the industries most affected by the shock. The most innovative feature of the measures adopted in the current episode is the design of its price-containment measures. They have been designed as temporary interventions with tax reductions scheduled to be phased out over time, but subject to safeguard clauses that are activated if price increases over the preceding months exceed certain thresholds. However, since the energy-related tax measures remain broad-based in nature, their distributional effects on households can be expected to be comparable to those observed in the previous episode.
The cuts in energy taxes appear to have significantly dampened the surge in prices. According to the National Statistics Institute, energy inflation stood at 17.1% year-on-year in August, compared with 21.6% had tax rates remained unchanged. In the euro area, where measures were smaller in budgetary terms, the effect appears to have been much more limited, according to Eurostat (14.3%, compared with 15.1%). As a result, the tax cuts narrowed Spain’s energy inflation differential vis-à-vis the euro area from 6.5 pp to 2.8 pp.
According to the Banco de España’s estimates, the extension and increase of the reduction in excise duties on hydrocarbons approved under Royal Decree-Law 25/2026 will also lower average inflation in 2026 by 0.14 pp. This effect would stem mainly from a 1.6 pp reduction in average energy inflation, given that second-round effects of the energy shock on core inflation have so far remained limited. However, the temporary nature of these measures means that some of these outcomes will be reversed once they are withdrawn. Lastly, since the safeguard clauses link the duration of the tax cuts to developments in energy prices, both their budgetary cost and their impact on inflation in 2026 will depend on September and October consumer price index (CPI) data.
Table 1 Fiscal measures in response to the energy crisis caused by the conflict in the Middle East: Royal Decree-Law 7/2026, Royal Decree-Law 18/2026 and Royal Decree-Law 25/2026 (a)
| Amount (% of GDP) |
Period in force | |
|---|---|---|
| PACKAGE 1 - Royal Decree-Law 7/2026 of 20 March 2026 (Official State Gazette of 21 March) | ||
| Reduction in energy taxes | 0,14 | |
| Reduction in VAT on motor fuels (from 21% to 10%) | 22 Mar-30 Jun 2026 | |
| Reduction in VAT on electricity, gas and firewood (from 21% to 10%) (b) | 22 Mar-31 May 2026 | |
Reduction in the hydrocarbon excise duty (standard-grade diesel: –4.9 cents/l; 95-octane petrol: –11.4 cents/l) |
22 Mar-30 Jun 2026 | |
| Reduction in the excise duty on electricity from 5.11% to 0.50% (b) | 22 Mar-31 May 2026 | |
| Reduction in the electricity generation tax base in 2026 H1 (c) | 1 Jan-30 Jun 2026 | |
| Subsidies, direct grants and other measures | 0,14 | |
| Diesel subsidy (20 cents/l) for transport and agriculture | 22 Mar-30 Jun 2026 | |
| Subsidy to offset rising fertiliser costs | 22 Mar-31 Dec 2026 | |
| Energy-intensive industry: 80% reduction in network charges and compensation of indirect CO2 emission costs | 22 Mar-31 Dec 2026 | |
| Personal income tax deduction for the purchase of electric vehicles (Auto+ Programme) | 22 Mar-31 Dec 2026 | |
Support for the fishing fleet and financing facilities for the agricultural and fisheries sectors (SAECA guarantees) |
22 Mar-31 Dec 2026 | |
| Heating subsidy, increased flexibility in electricity and natural gas contracts and zero levy on gas storage | 22 Mar 2026-31 Mar 2027 | |
| Subsidies for maritime transport | 22 Mar-30 Jun 2026 | |
| PACKAGE 1 TOTAL | 0,28 | |
| PACKAGE 2 - Royal Decree-Law 18/2026 of 29 June 2026 (Official State Gazette of 30 June) | ||
| Reduction in energy taxes | 0,09 | |
| Reduction in the hydrocarbon excise duty Jul-Sep (standard-grade diesel: –15/–10/–20 cents/l; 95-octane petrol: –15/–10/–5 cents/l) (d) | 1 Jul-30 Sep 2026 | |
| Reduction in the electricity generation tax base during 2026 H2 (c) | 1 Jul-31 Dec 2026 | |
| Subsidies, direct grants and other measures | 0,03 | |
| Professional diesel subsidy (road transport) | 1 Jul-30 Sep 2026 | |
| Extension of support measures for the primary sector (agricultural diesel and fishing fleet) | 1 Jul-30 Sep 2026 | |
| Funding for fertiliser support scheme | 1 Jul-31 Dec 2026 | |
| Other transport support measures (non-repayable aid, rail and maritime transport) | 22 Jun-31 Dec 2026 | |
| PACKAGE 2 TOTAL | 0,13 | |
| PACKAGE 3 - Royal Decree-Law 25/2026 of 29 September 2026 (Official State Gazette of 30 September) (f) | ||
| Reduction in energy taxes | 0,11 | |
Reduction in the hydrocarbon excise duty Oct-Dec (standard-grade diesel and 95-octane petrol: –20/–20/ –20 cents/l) (e) |
1 Oct-31 Dec 2026 | |
| Subsidies, direct grants and other measures | 0,01 | |
| Professional diesel subsidy (road transport) | 1 Oct-31 Dec 2026 | |
| Extension of support measures for the primary sector (agricultural diesel and fishing fleet) | 1 Oct-31 Dec 2026 | |
| Other transport support measures (non-repayable aid, rail and maritime transport) | 22 Sep-31 Dec 2026 | |
| PACKAGE 3 TOTAL | 0,12 | |
| OVERALL TOTAL (package 1 + package 2 + package 3) | 0,52 |
SOURCE: Banco de España.
Banco de España estimate based on the information available up to 30 September 2026, including the three packages of measures and the CPI-linked safeguard clauses. It does not include Royal Decree-Law 9/2026 on urgent transport measures, which allocates €40 million to supplementary appropriations for maritime and rail transport.
The reduction in VAT on electricity, gas and firewood and in the excise duty on electricity expired on 31 May 2026, as the conditions for triggering the CPI-linked extension clause were not met (Art. 40 and 42 of Royal Decree-Law 7/2026); the reductions in the hydrocarbon excise duty and VAT on motor fuels remained in force until 30 June 2026.
Legislated schedule: tax base reduced by 10% in Q1 and 100% in Q2 (Royal Decree-Law 7/2026), and 30% in Q3 and 40% in Q4 (Royal Decree-Law 18/2026). A rate of 3.5% is established for 2027 and of 0% from 2028 onwards. Only the impact in 2026 is quantified. The fiscal cost for 2026 is not measured as foregone tax revenue, but as the compensatory subsidy to the electricity system that replaces it (€315 million, First Additional Provision of Royal Decree-Law 18/2026, in addition to that already recognised in the Fourteenth Additional Provision of Royal Decree-Law 7/2026).
Calculated bearing in mind the CPI-linked safeguard clauses in Royal Decree-Law 18/2026. Following the publication of the CPIs for June and July, these clauses were activated for diesel (September: excise duty on hydrocarbons of €0.179/l, equivalent to a 20-cent reduction instead of a 5-cent one) and for heating oil (August and September: €0.021/l). The reductions in VAT on electricity, gas and firewood and in the excise duty on electricity were not reactivated and remain unchanged at zero. The reduction applicable to petrol was not reactivated either. Monthly tax reductions are measured relative to the standard pre-crisis rate.
Assuming, based on the Banco de España price forecasts, that the safeguard clauses of Royal Decree-Law 25/2026 for petrol and diesel are activated (that is, that the CPI in September and October is at least 15% higher than in the same month of the previous year): the reduction in the hydrocarbon excise duty would remain at 20 cents/l in November and December (rather than at 13 cents and 6 cents without the activation) and the reduction for heating oil would remain at the EU minimum level. Therefore, the subsidy for professional diesel is reduced to 5 cents/l over the three months. The reductions in VAT on electricity, gas and firewood and in the excise duty on electricity are not reactivated.
The following are not included because they do not have a direct budgetary cost: the cap on the increase in the commodity cost component of the natural gas regulated rate for small consumers, given that this difference is recovered through subsequent rate revisions; the cap on the price of bottled liquefied petroleum gas to June 2027, which is also recoverable; the increase in liquefied natural gas reserves; the ban on dismissals for firms receiving support; and the studies conducted by the National Commission on Markets and Competition. The €4 million contribution to the National Energy Efficiency Fund for Ceuta and Melilla or the compensation to the Canary Islands, for which no amount has been determined, are also not included.
The measures adopted are relevant to household well-being, albeit through different channels. The reductions in energy taxes (amounting to around 0.34% of GDP and accounting for roughly 65% of the total cost of the measures) have a more direct and immediate effect on the prices of the goods consumed by households. The impact of these measures can therefore be allocated to individual households on the basis of their observed consumption basket, assuming full pass-through.21 The subsidies and direct support granted to the most energy-intensive sectors (amounting to around 0.18% of GDP) affect households indirectly. These indirect effects are mainly transmitted through the end prices of the goods and services produced by the beneficiary sectors, as well as through the income and employment generated by those sectors. The impact on households is therefore more uncertain and its calculation would depend on assumptions regarding the extent and speed of the pass-through. As such, a distributional assessment of these measures falls outside the scope of this exercise.
The distributional analysis presented below is limited to measures that have a direct impact on the prices of the energy products consumed by households. Specifically, these comprise reductions in VAT and excise duties on electricity, gas and motor fuels. The direct savings generated by these measures for households as a whole are estimated at around €3,675 million (approximately 0.21% of GDP). This amount accounts for slightly less than two-thirds of the total cost of the tax reductions adopted, which also extend to firms and the general government.
The distributional impact of the tax reductions on households
The distributional analysis of the tax measures affecting households follows the methodological approach set out in García-Miralles (2023).22 This approach uses household spending on the affected goods as recorded in the 2024 Household Budget Survey, updated to reflect recent price developments. It documents household consumption patterns and estimates the distributional impact of the tax reductions.23 It should be noted that these estimates are based on household consumption patterns observed in 2024 and therefore do not capture any changes in consumption behaviour that may have occurred since 2025 or in response to the current energy shock. In addition, the estimates are based on a 2026 price scenario that is subject to uncertainty and should therefore be interpreted as indicative orders of magnitude.
The distributional impact of the measures is assessed using two complementary indicators: (i) average tax savings per household (in euro); and (ii) tax savings as a share of total household spending (as a percentage of spending). These indicators are estimated for each decile of equivalised household expenditure.24
The average savings per household resulting from the tax reductions on electricity, gas and motor fuels are estimated to increase across the expenditure distribution, from around €105 in the lowest decile to €264 in the highest (Chart 1.a). This aggregate result masks substantial differences across products. The savings associated with the electricity tax reductions are relatively similar across expenditure groups (between €46 and €69), whereas those related to motor fuels increase markedly along the distribution (between €56 and €188). The impact of the fuel measure reflects the fact that motor fuel consumption is more heavily concentrated among higher-spending households.
In terms of the tax savings relative to household expenditure, however, the tax reductions display an overall progressive distributional profile. The savings generated by the measures decline from around 0.61% of expenditure in the lowest decile to 0.37% in the highest (Chart 1.b). This pattern is driven primarily by the electricity tax reduction, as electricity accounts for a relatively larger share of the consumption basket of vulnerable households at the lower end of the distribution. The savings associated with this component fall from 0.3% of expenditure in the first decile to 0.1% in the last, whereas the reduction in taxation on motor fuels exhibits an almost flat profile.
These findings highlight that broad-based measures aimed at containing price increases can have markedly different distributional effects. It is also worth noting that the reduction in motor fuel taxes (which yields greater savings in euro terms for households with higher fuel expenditures, although representing a similar share of household spending across the distribution) affects a good for which lower consumption is considered desirable for both geopolitical and environmental reasons, amid a contraction in supply.25 Moreover, in the case of diesel, the safeguard measure introduced in September increased its tax advantage over petrol from 9.4 to 24.4 cents per litre, running counter to the more structural objective of bringing diesel taxation into line with petrol taxation, as set out in the Recovery, Transformation and Resilience Plan. In contrast, the cut in taxes on electricity is more closely aligned with these objectives, as it combines support for vulnerable households with a system of price signals that favours more resilient and sustainable energy sources.
Chart 1 Impact of the energy tax cuts on households, by expenditure group (a)
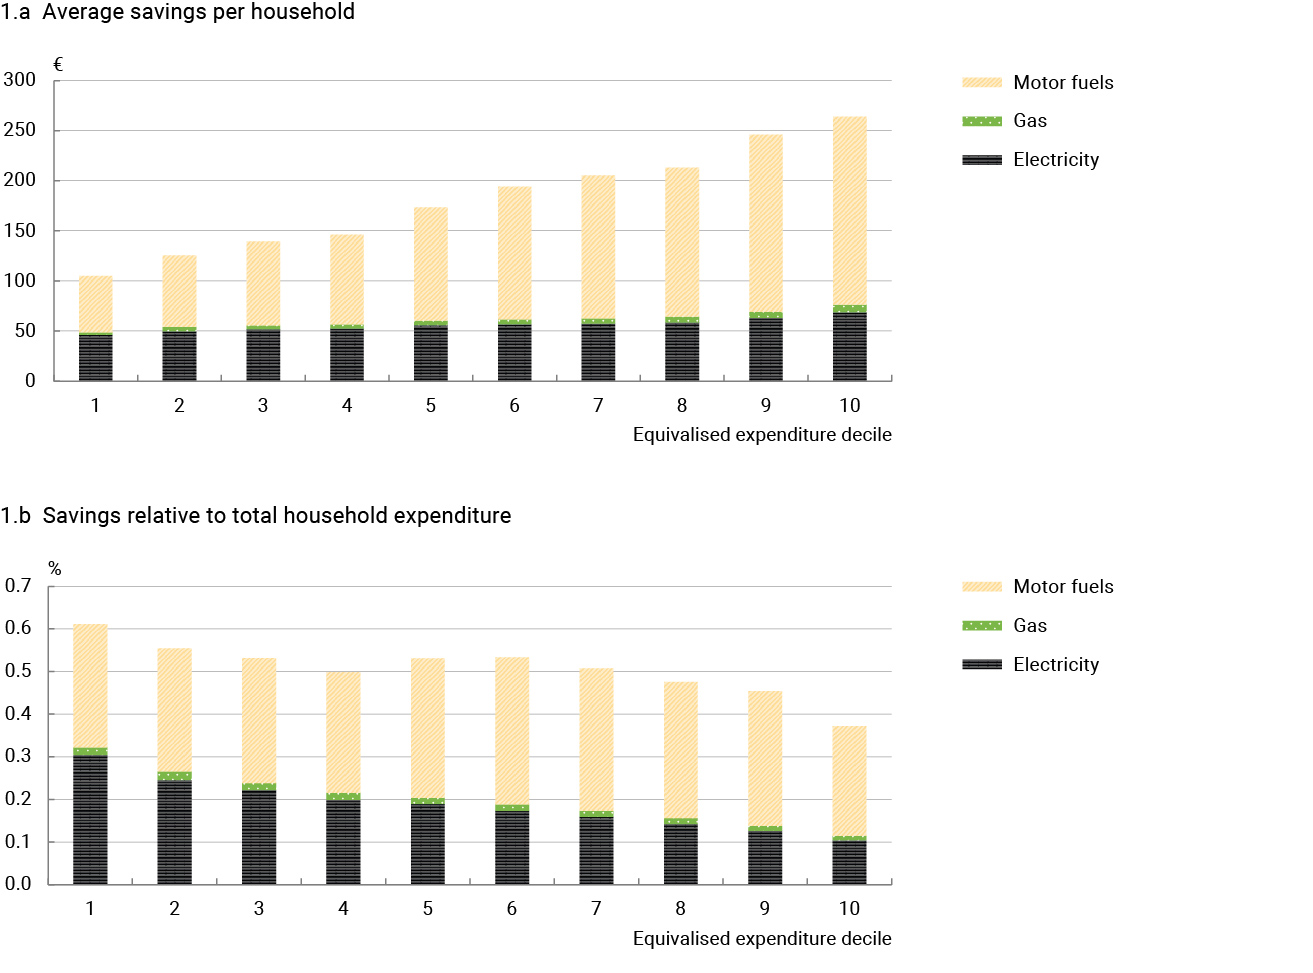
SOURCE: Banco de España, drawing on Household Budget Survey data.
Considering Royal Decree-Law 7/2026, Royal Decree-Law 18/2026 and Royal Decree-Law 25/2026. The motor fuel tax cut comprises the reductions in VAT and the hydrocarbon excise duty. The gas tax cut comprises the reduction in VAT. The electricity tax cut comprises the reductions in VAT, the excise duty on electricity and the electricity generation tax base. See Table 1 for more details of the duration of these reductions and the applicable tax rates.
The persistence of the Iran conflict and there being no stable resolution in sight continue to generate a high degree of uncertainty regarding international geopolitical and economic developments. This uncertainty has triggered elevated energy market volatility, leading to higher oil and gas spot prices and a rise in their prices on futures markets. If these tensions continue or escalate further, they could have a more severe impact on the global energy supply, by disrupting the main shipping routes and global supply chains, and drive up energy prices as a result. Higher energy prices would give rise to persistent adverse effects on inflation and economic activity worldwide. These risks are particularly relevant for an open economy such as Spain’s, which is exposed to external shocks through the energy, trade and financial channels.
Against this backdrop, a single baseline macroeconomic projection does not adequately capture the conflict’s range of possible outcomes. It is therefore advisable to consider different geopolitical scenarios: a diplomatic resolution, intermediate cases (such as a protracted conflict and a partial resumption of energy flows) and an escalation of the war.
This box presents the effects of different geopolitical scenarios on economic activity and inflation in Spain. To do so, it uses the methodology in Alonso-Alvarez, Kataryniuk, López-Salido and Pérez (2026) 26 to translate the corresponding geopolitical narratives into assumptions about the duration of the disruptions, supply and energy prices. These assumptions generate different energy price paths to those priced in by the futures markets at the cut-off date for the assumptions used in the projections. The alternative paths determine, in turn, international economic developments and affect the outlook for the Spanish economy.
Three alternatives to the baseline scenario of these macroeconomic projections are considered. The first envisages a diplomatic resolution to the conflict and energy flows gradually returning to normal. In the second scenario heightened geopolitical tensions prompt greater disruptions to the global energy supply and increases in oil and natural gas transportation costs. The third is a “combined” scenario, which incorporates the average path for energy prices under the different geopolitical scenarios, weighted by the probability of each scenario occurring. Chart 1 depicts the different oil price paths under each scenario.
Chart 1 Oil prices under the different scenarios
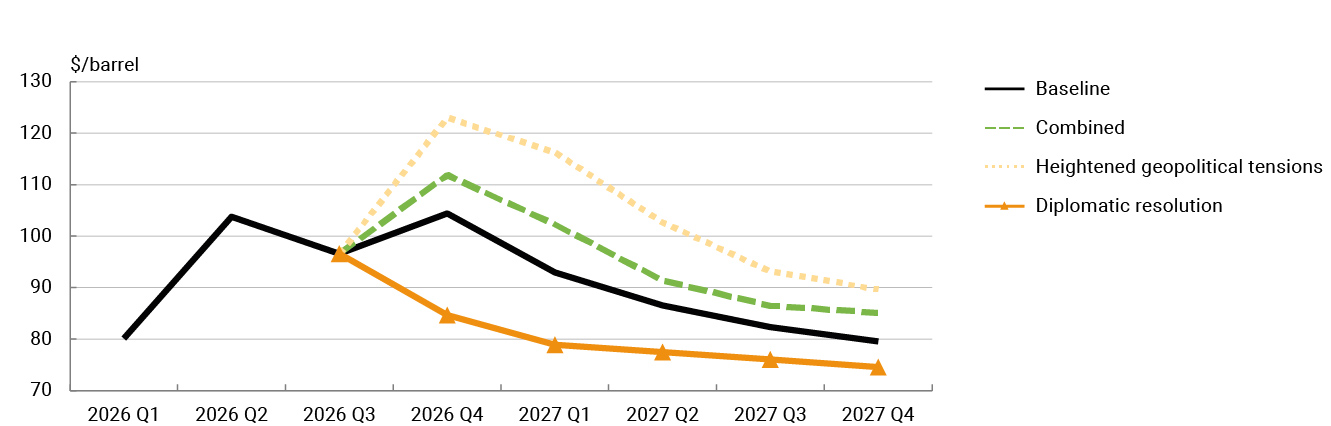
SOURCES: LSEG and Banco de España.
Table 1 reflects the estimated impact of the three alternative scenarios on GDP growth and inflation in Spain. Compared with the baseline, the combined scenario reduces GDP growth for 2027 by 0.2 percentage points (pp) and raises the inflation rate by 0.3 pp. The most severe scenario reduces GDP growth for 2027 by 0.6 pp and raises inflation by close to 1 pp, while the most benign scenario raises GDP growth by 0.4 pp and reduces inflation by 0.5 pp.
Table 1 Impact on GDP and inflation of different geopolitical scenarios
| % and pp | ||||
|---|---|---|---|---|
| GDP growth | Inflation rate | |||
| 2026 | 2027 | 2026 | 2027 | |
| Baseline | 2,6 | 2,2 | 3,9 | 3,7 |
| Differences with respect to the baseline (pp) | ||||
| Combined | 0,0 | -0,2 | 0,1 | 0,3 |
| Heightened geopolitical tensions | -0,1 | -0,6 | 0,2 | 0,9 |
| Diplomatic resolution | 0,1 | 0,4 | -0,2 | -0,5 |
SOURCE: Banco de España.
Banco de España. (2026). Financial Stability Report. Spring 2026. https://doi.org/10.53479/43188↩︎
According to the EBAE, in recent quarters nearly 60% of construction firms point to labour shortages as a negative or highly negative factor hindering their business. This percentage has been on the rise since 2021 and has stood above 50% since mid-2023.↩︎
While Spain recorded a net debtor position equivalent to 44.7% of GDP in 2025, the corresponding figure for France was 29.6% of GDP. By contrast, Germany and Italy posted net creditor positions of 81.2% and 15.4% of GDP, respectively.↩︎
The results presented in this box were calculated using weights designed to replicate the distribution of employment by sector (15 sectors) and size (four size intervals) in the Statistics for Social Security-registered Firms (Estadística de Empresas Inscritas en la Seguridad Social).↩︎
Respondent firms’ responses are summarised in an index that weights their qualitative assessments based on the following five-point scale: significant decrease = -2, slight decrease = -1, unchanged = 0, slight increase = 1, significant increase = 2.↩︎
The available EBAE time series are still too brief to apply the standard seasonal adjustment techniques so the seasonal component was estimated by constructing a provisional seasonally adjusted time series based on an estimation of the historical relationship between the EBAE turnover indicator and the tax authorities’ original quarterly series of turnover at large firms and small and medium-sized enterprises (SMEs). This is a preliminary estimate to be revised in the future.↩︎
In line with the seasonal adjustment to turnover, to estimate the seasonal component a provisional seasonally adjusted time series was constructed based on an estimation of the historical relationship between the EBAE employment indicator and the Spanish Labour Force Survey’s quarterly employment series. This is a preliminary estimate to be revised in the future.↩︎
This variable cost is calculated using that of an efficient combined-cycle plant, which consumes around 2 MWh of gas and emits approximately 0.4 tonnes of CO₂ for every MWh of electricity generated.↩︎
The impact of this pass-through to the harmonised index of consumer prices (HICP) was greater in Spain before 2023, as measuring the electricity component of the HICP mostly depended on the regulated rate for small consumers.↩︎
According to the National Commission on Markets and Competition’s Informe de supervisión de los mercados minoristas de gas y electricidad (gas and electricity retail markets supervision report).↩︎
Matias Pacce, Isabel Sánchez and Marta Suárez-Varela. (2021). “Recent developments in Spanish retail electricity prices: the role played by the cost of CO2 emission allowances and higher gas prices”. Documentos Ocasionales, 2120, Banco de España.↩︎
Having been gradually phased in, as of 1 January 2026 45% of the price stems from the daily wholesale market and the remaining 55% is calculated based on forward or futures markets (using monthly, quarterly and annual benchmarks).↩︎
Electricity inflation in Germany, France and Italy is similar if the measures adopted to mitigate the impact of the conflict in the Middle East are taken into account, as reflected by the electricity inflation time series at constant tax rates in Chart 3.↩︎
The September data relate to the flash estimate. The inflation differentials in this box are calculated using unrounded rates of change in the price indices for Spain and the euro area.↩︎
Calculated as the difference between energy inflation at constant tax rates and the rate observed. This gap reached a low of -13.9 pp in May 2026 (Chart 3).↩︎
Banco de España. (2026). “Box 1.4.Fiscal responses to inflationary energy shocks: past experience and recent developments”. In Banco de España, Annual Report 2025, pp. 105-111, and Antonio F. Amores, Henrique Basso, Johannes Simeon Bischl, Paola De Agostini, Silvia De Poli, Emanuele Dicarlo, Maria Flevotomou, Maximilian Freier, Sofia Maier, Esteban García-Miralles, Myroslav Pidkuyko, Mattia Ricci and Sara Riscado. (2025). “Inflation, fiscal policy, and inequality: the impact of the post-pandemic price surge and fiscal measures on European households”. The Review of Income and Wealth, 71(1).↩︎
OECD. (2026). “Energy prices are spiking again. New relief measures, old lessons”. OECD Policy Briefs, 13 April.↩︎
European Commission. (2026). “Policy measures in EU Member States to address the 2026 energy price shock”. Annex to the spring 2026 economic forecasts, 21 May.↩︎
ECB. (2026). “Box 8.Assessing the scope for compensatory fiscal measures in response to the recent energy shock”. In ECB, Economic Bulletin, 5/2026.↩︎
OECD. (2026). OECD Economic Outlook, 2026/1. Chapter on Spain, June.↩︎
For Spain, the available evidence from the 2022-23 inflationary episode tends to point to high rates of pass-through in fuels and food products. See Juan Luis Jiménez, Jordi Perdiguero and José Manuel Cazorla-Artiles. (2025). “The pass-through of subsidizing petrol consumption: the case of Spain”. SERIEs, 16, pp. 107-135, and Nicolás Forteza, Elvira Prades and Marc Roca. (2025). “Analyzing VAT pass-through in Spain using web-scraped supermarket data and machine learning”. SERIEs, 16, pp. 137-189.↩︎
Esteban García-Miralles. (2023). “Support measures in the face of the energy crisis and the rise in inflation: an analysis of the cost and distributional effects of some of the measures rolled out based on their degree of targeting”. Economic Bulletin - Banco de España, 2023/Q1, 15.↩︎
The analysis is performed at the household level. 2024 prices are updated for 2026 using the CPI and an estimated product-specific energy shock component. For electricity, the estimated savings incorporate not only the reductions in VAT and the excise duty on electricity, but also the tax base reduction in the tax on electricity generation. The pass-through of the latter to end prices is assumed to be proportional to the reduction in the tax base.↩︎
A household’s equivalised expenditure is defined as its total spending adjusted by the size of the household based on the modified equivalence scale of the Organisation for Economic Co-operation and Development.↩︎
See European Green Deal and European Defence Readiness 2030.↩︎
Irma Alonso-Alvarez, Iván Kataryniuk, David López-Salido and Javier. J. Pérez. (2026). “Geopolitical Oil-Supply Scenarios and Macroeconomic Risks: A Bayesian Toolkit for Policy Analysis”. Documentos Ocasionales, 2616, Banco de España.↩︎
Cut-off date for data: 2 October 2026.
Publication date: 9 October 2026.
Reproduction for educational and non-commercial purposes is permitted
provided that the source is acknowledged.
© Banco de España, 2026
ISSN: 3127-210X (online edition)
https://doi.org/10.53479/44588