The EUROPROD-UA database contains annual and quarterly series for Total Factor Productivity (TFP) growth for five Euro Area countries. The series are adjusted for changes in factor utilization and for non-zero profits, as explained in the Handbook for Version 1.0 ![]() (1 MB). Further details on the methodology can be found in Comin, Quintana, Schmitz and Trigari (2025)
(1 MB). Further details on the methodology can be found in Comin, Quintana, Schmitz and Trigari (2025)![]() .
.
EUROPROD-UA currently covers Germany, France, Italy, Spain and the Netherlands. Annual data is available at both the industry and aggregate levels and covers the period 1995-2020. Quarterly data is only available at the aggregate level and covers the period 1998Q1-2025Q2.
Suggested citations:
- Comin, D., Quintana, J., Schmitz, T., & Trigari, A. (2025). Revisiting productivity dynamics in Europe: A new measure of utilization-adjusted TFP growth. Journal of the European Economic Association.
- Meli, R., Quintana, J., Schmitz, T., & Trigari, A. (2025). European Utilization-Adjusted Productivity Growth. Occasional Paper, Bank of Spain.
The latest data can be downloaded below. An archive of past versions is also available at the bottom of the page.
EUROPROD-UA Data, Version 1.1 ![]() (365 KB)
(365 KB)
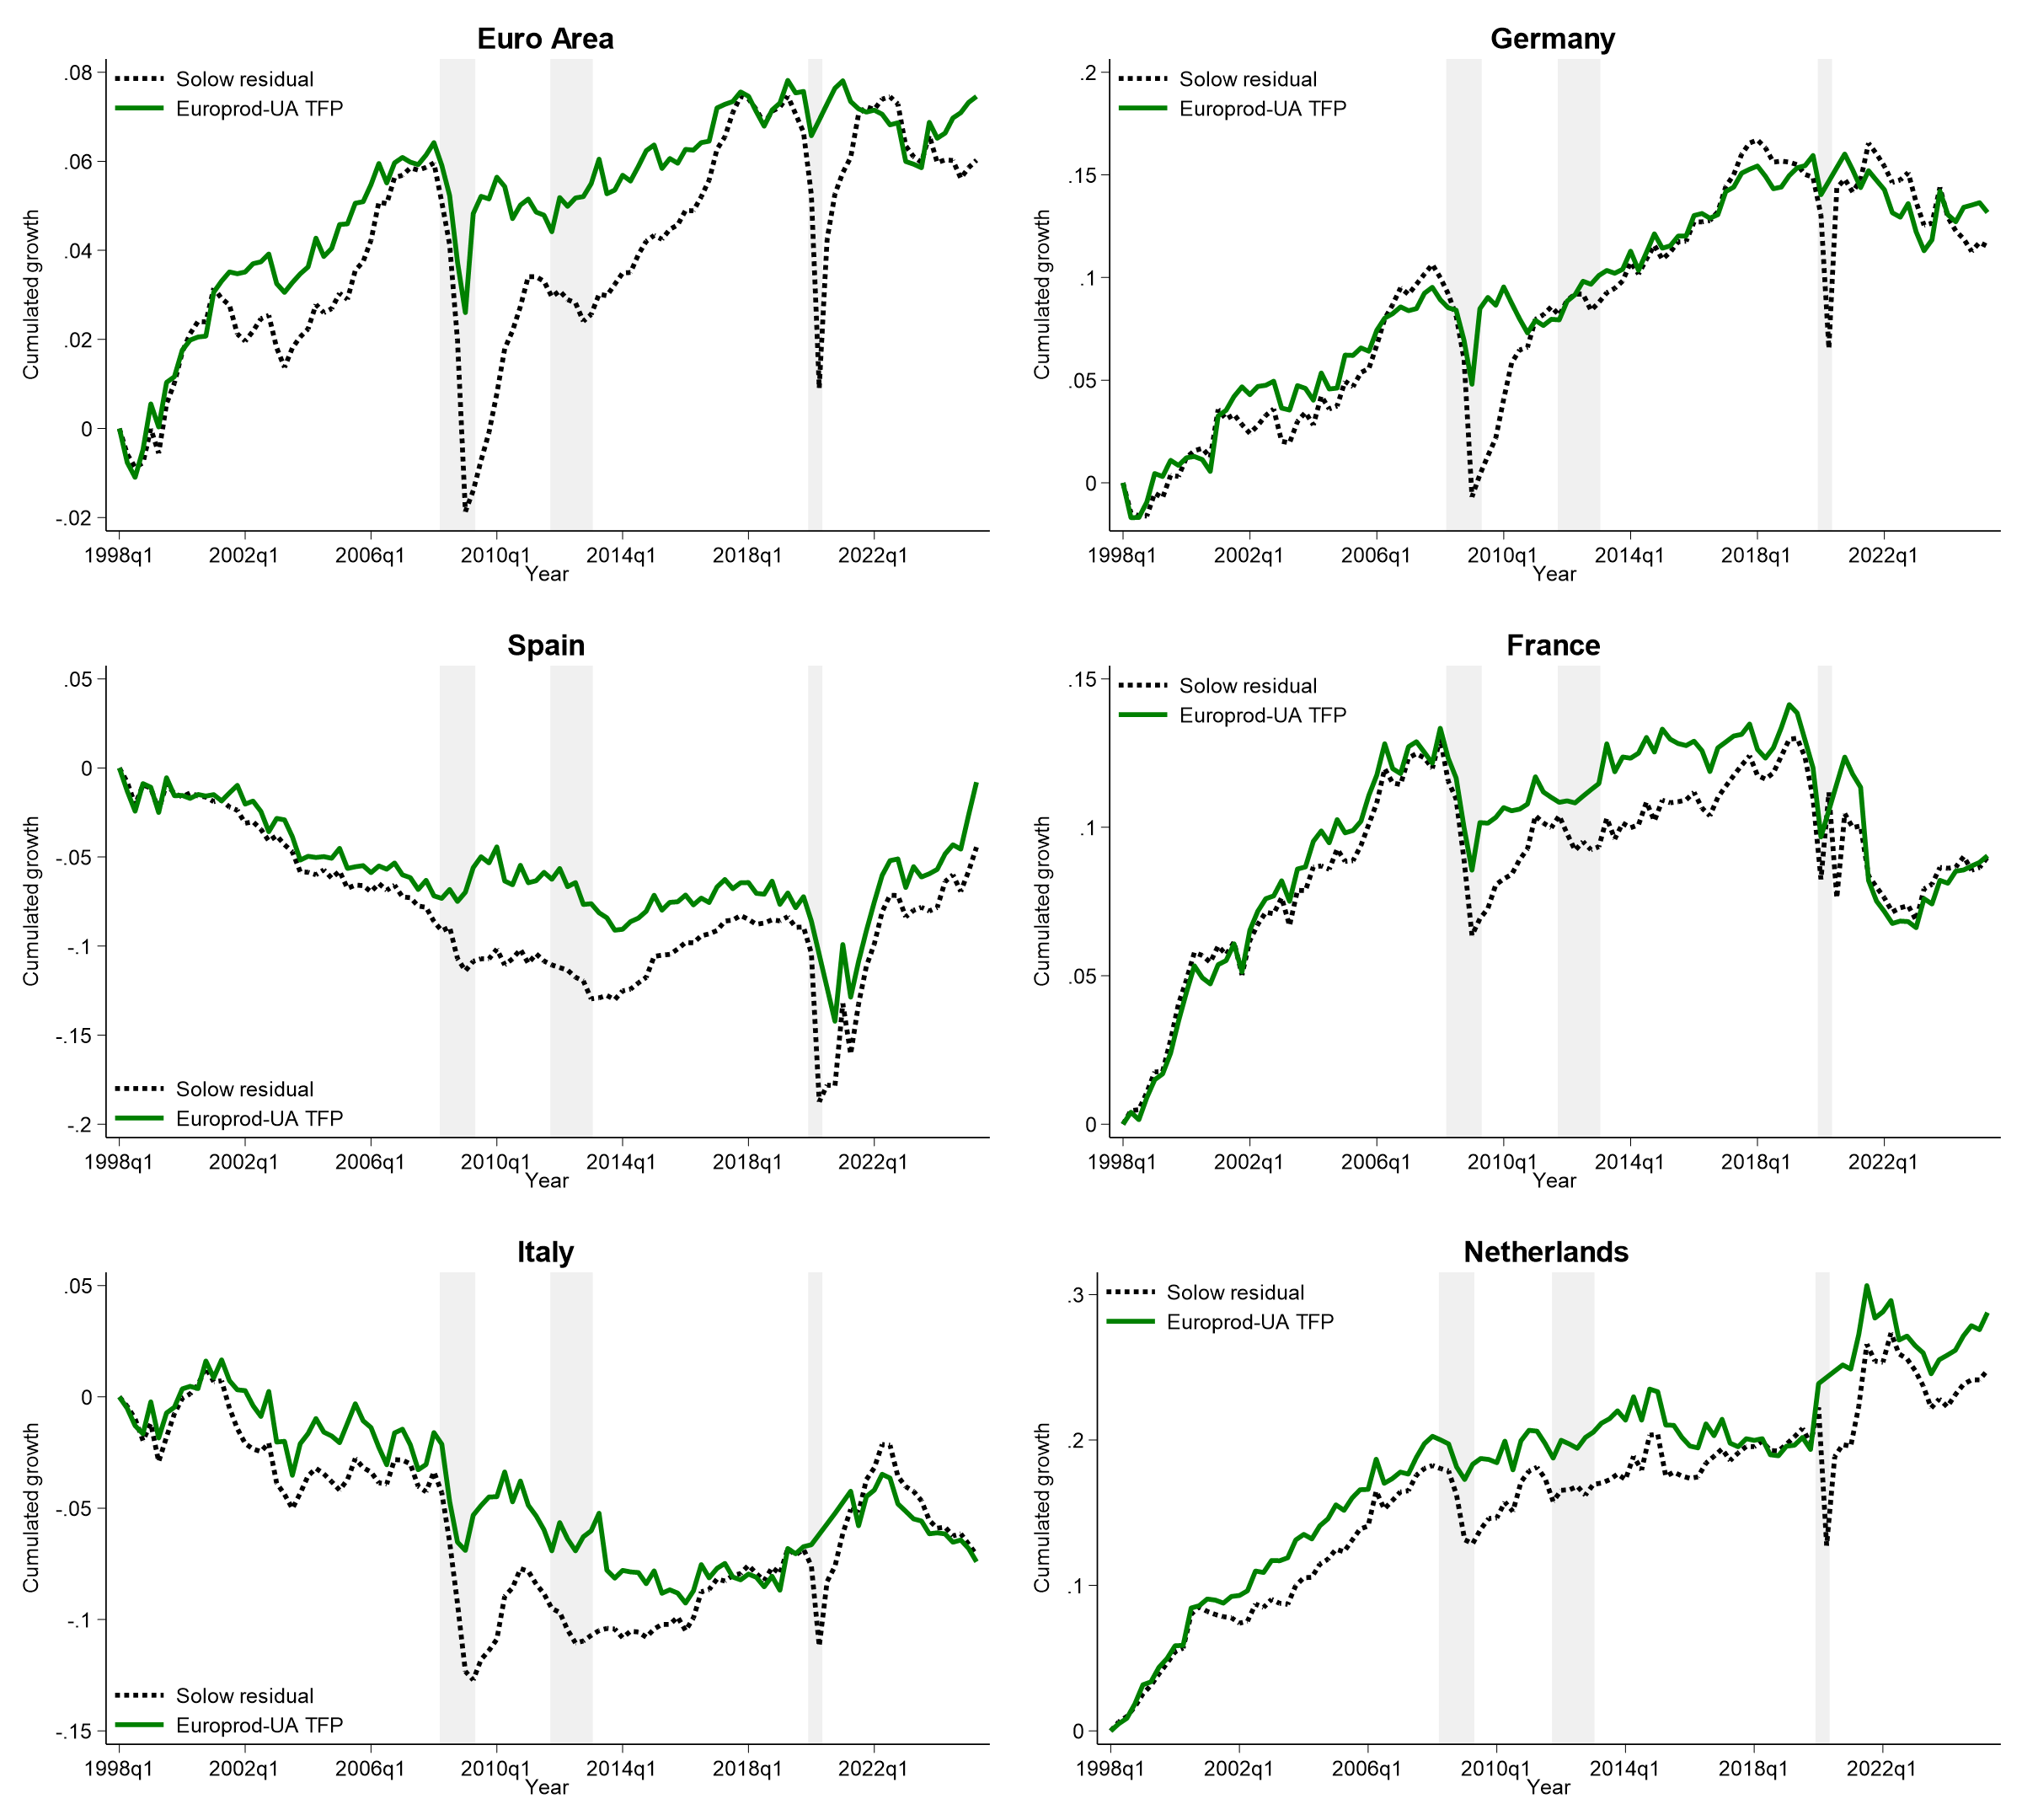
This figure plots the EUROPROD-UA quarterly measure of cumulated TFP growth against a quarterly Solow residual. Shaded areas mark recessions. All series are normalized to zero in 1998Q1. Growth rates between 2020Q2 and 2020Q4 are interpolated to account for the impact of the Covid-19 pandemic.
Archive of past versions
Version 1.1 (October 2025) ![]() (365 KB)
(365 KB)