What does the Banco de España’s bottleneck index tell us about the economic impact of the tensions in the Red Sea?
The Red Sea crisis is driving up global shipping costs. However, our bottleneck indicator suggests that, for the time being, the economic impact is limited compared with other previous episodes. In any event, developments must be closely monitored. Our daily bottleneck indicator enables us to track the situation in real time.
4 min
In recent years world trade has been severely disrupted. This has led to bottlenecks, leaving global supplies of certain goods and services unable to keep up with demand. These supply and demand mismatches have an adverse effect on economic activity and generate inflationary pressures. Given their importance for the economy, the Banco de España has constructed an indicator to assess these bottlenecks in real time. What can it tell us about the current tensions in the Red Sea and their economic implications?
Since mid-December shipping has been hit by the upheaval in the Middle East. The main route affected is the Suez Canal, which carries 30% of the world’s container traffic.The attacks by Yemen's Houthi rebels on cargo ships in the Red Sea have raised the risks for shipping in the area and driven up insurance costs. This has led to a great deal of maritime traffic being rerouted around Africa. As a result, shipping in the Red Sea has fallen by 40% since the onset of the crisis![]() , and both journey times and costs are rising, as seen in Chart 1.
, and both journey times and costs are rising, as seen in Chart 1.
Chart 1
SHIPPING COSTS HAVE RISEN CONSIDERABLY
![]()
SOURCE: Refinitiv.
NOTE: The global index (Freightos Baltic Global index) measures the cost of maritime container transport on 12 key routes. The Suez Canal index is the Freightos China to Mediterranean index focusing on the route passing through the Suez Canal. The figures are daily. Latest figure: 25 January 2024.
This is not a new situation. Since the pandemic lockdowns in 2020, the global economic outlook has frequently been plagued by bottlenecks. The Russian invasion of Ukraine made matters worse, in this case affecting the supply of energy and agricultural products. And now the Red Sea crisis.
The implications of supply bottlenecks and how to measure them
International trade disruption affects global supply and production chains, causing shortages or delays in deliveries of final products and key components. As we saw when economies started to recover post-lockdown ![]() (256 KB), this results in supply and demand mismatches, which have an adverse effect on economic activity. These mismatches also tend to drive up inflation. Supply chain difficulties during the pandemic are estimated
(256 KB), this results in supply and demand mismatches, which have an adverse effect on economic activity. These mismatches also tend to drive up inflation. Supply chain difficulties during the pandemic are estimated![]() to have pushed up euro area underlying inflation by 1.2 percentage points and shaved 1.9% off GDP.
to have pushed up euro area underlying inflation by 1.2 percentage points and shaved 1.9% off GDP.
In recent years, as supply difficulties have become more widespread and their economic impact has increased, several indicators have been constructed to monitor their development. For instance, the Federal Reserve Bank of New York’s Global Supply Chain Pressure Index![]() (a monthly index), and the European Commission’s quarterly surveys on production constraints.
(a monthly index), and the European Commission’s quarterly surveys on production constraints.
Our Index has the advantage that it can be calculated daily. It draws on text mining of press reports
The Banco de España publishes its own Supply Bottlenecks Index (SBI) monthly. Our Index has the advantage that it can be calculated daily, enabling real-time analysis of supply chain tensions. The Index was the subject of a recent academic publication![]() and draws on text mining of press reports.
and draws on text mining of press reports.
This approach enables selective searching, which gives the Index added value. Specifically, in addition to the main SBI for each of the main economies, numerous indices relating to specific events or sectors may be defined.
How does the index capture the tensions in the Red Sea?
Chart 2 shows the SBI that specifically measures the size of bottlenecks in the Red Sea and the Suez Canal. This indicator has recently surpassed the level seen in March 2021, when the cargo ship Ever Given ran aground, blocking the canal![]() for six days.
for six days.
Chart 2
BOTTLENECKS IN THE SUEZ CANAL ARE NOW ABOVE 2021 LEVELS
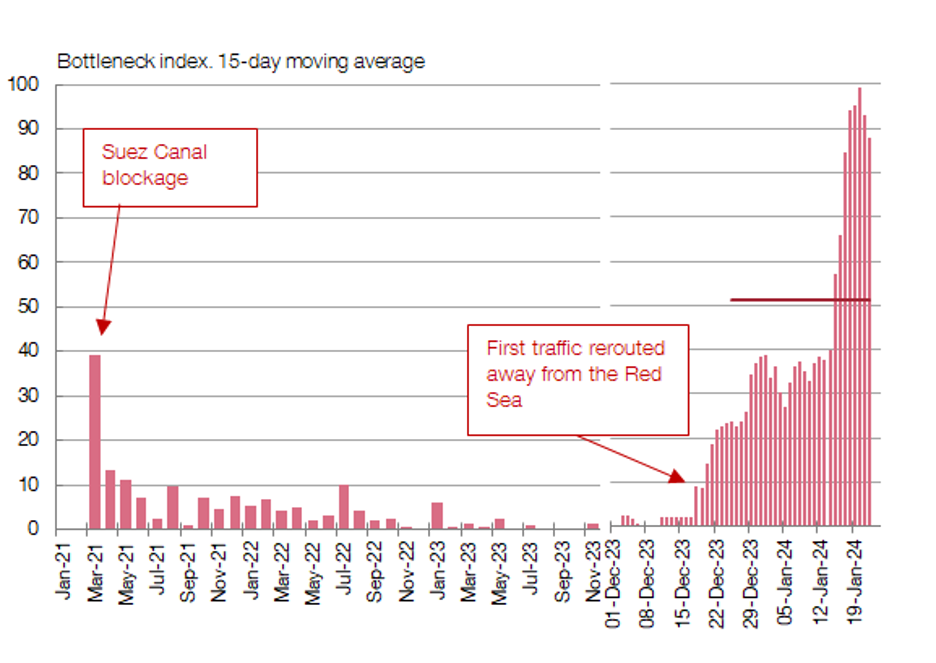
SOURCE: Banco de España, based on Burriel et al. (2024)![]() .
.
NOTE: The specific Suez Canal and Red Sea supply bottleneck index measures the proportion of newspaper items reporting supply problems in these areas (Burriel et al. (2024)). The euro area index is calculated as the average of the national indices for Germany, France, Italy and Spain. The thick bars are monthly averages and the thin bars represent daily figures. The horizontal line denotes the average for the last month. Latest data: 24 January.
Nonetheless, for the time being, the current crisis has had a limited impact on the main bottleneck index (see Chart 3). While the SBI has risen since mid-December, particularly in the euro area, it remains well below the record levels seen during the pandemic. The current weakness of global demand and the fact that the logistics industry and global supply chains were running smoothly before the current episode appear to have helped keep bottlenecks at bay.
Chart 3
THE MAIN BOTTLENECK INDEX IS STILL FAR FROM ITS PEAK
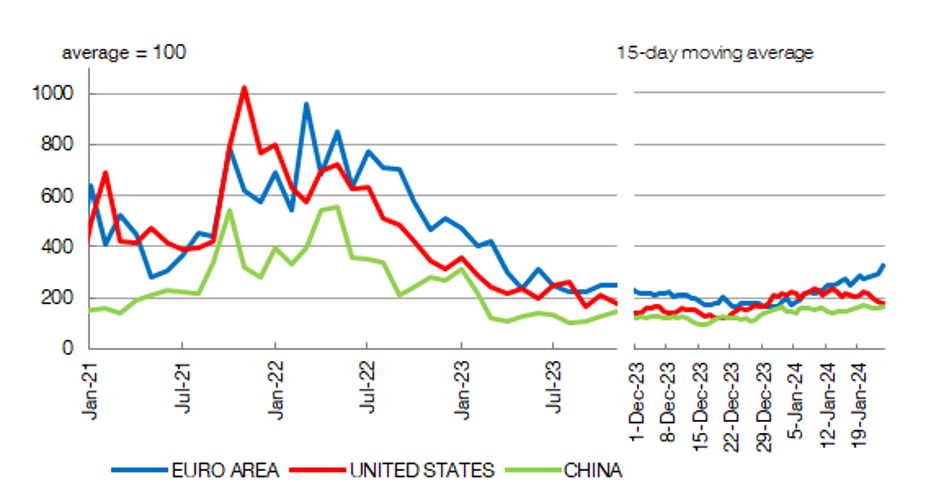
SOURCE: Banco de España, based on Burriel et al. (2024)![]() .
.
NOTE: The bottleneck index measures the proportion of newspaper items reporting supply problems and and its average up to December 2021 is set to 100 (Burriel et al., 2024). The euro area index is calculated as the average of the national indices for Germany, France, Italy and Spain. Latest data: 24 January
For the time being, the impact on inflation would be very limited. But the situation must be monitored closely. Our bottleneck index makes this easier
The available estimations suggest that, for the moment, the tensions in the Red Sea are likely to have very little impact on inflation, in line with their limited effect on the SBI. Nonetheless, in contrast to the Ever Given episode, there is considerable uncertainty over how the crisis might unfold, and events could take a turn for the worse. The situation must therefore be monitored closely. Our bottleneck index makes this easier, and is an important tool for analysing the current economic situation and outlook.

DISCLAIMER: The views expressed in this blog post are those of the author(s) and do not necessarily coincide with those of the Banco de España or the Eurosystem.